


Fed tightening cycles and the US dollar: what history shows
From 1994 and 1999 through to the dollar surge of 2022, history shows Fed tightening has produced very different outcomes for DXY.
Written by
David Scutt
Market Analyst
- Markets favour four Fed hikes by June next year
- US 2-year yields typically rise after first hike of cycle
- Dollar performance has varied sharply across tightening cycles
- Current DXY-rate correlations sit near historical extremes
- Dollar enters this likely cycle unusually weak relative to history
Markets widely expect the Federal Reserve to begin what is shaping up to be more than just a one-off rate adjustment on Wednesday, with the move seen as the start of a meaningful tightening cycle. That would mark a stark turnaround from earlier this year, when markets were still pricing multiple rate cuts before the outbreak of the Iran war.
Despite the prospect of a meaningful lift in front-end rates, history suggests that does not necessarily guarantee dollar strength in the wake of the Fed’s first hike.
From cuts to hikes in a matter of months
Source: TradingView
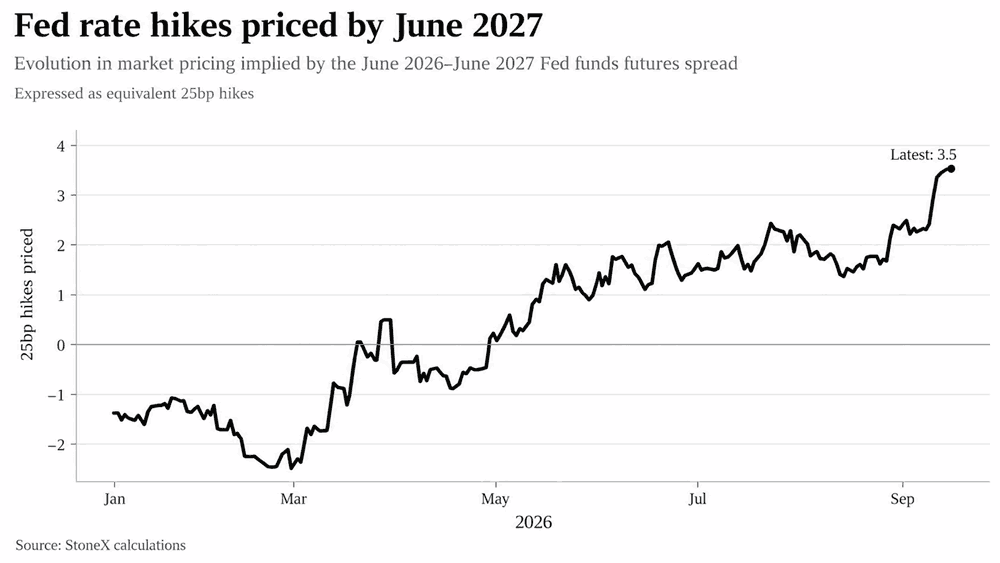
Heading into the September FOMC, markets are more than 90% priced for a hike to be delivered, making it close to a lock. If the Fed were to hold rates steady instead, the credibility hit would be significant, potentially triggering wild moves in the dollar and the back end of the Treasury curve.
Assuming the Fed does lift rates on Wednesday, markets are confident this would not simply be a one-off adjustment like we saw in 1997. Before the Iran war, pricing still favoured multiple rate cuts this year. That has since swung entirely in the opposite direction, with multiple hikes now expected and the curve out to June next year favouring four in total.
If delivered, that would unwind all of 2025’s easing and then some.
Six modern tightening cycles in focus
With a meaningful tightening cycle now priced, the obvious question is how markets have behaved around similar Fed restarts in the past.
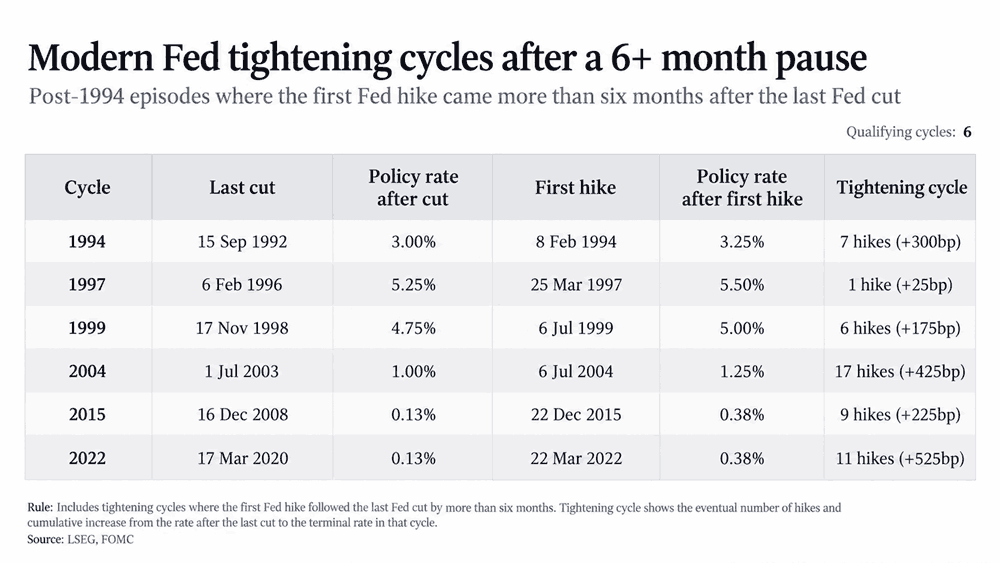
To keep the comparison relevant, we looked at post-1994 episodes where the first hike came at least six months after the previous cut. That leaves six cycles: 1994, 1997, 1999, 2004, 2015 and 2022.
Source: LSEG
The eventual scale of tightening varied significantly, but all except 1997 marked the start of a broader hiking cycle. In that instance, the Fed delivered a single 25bp mid-cycle adjustment.
The 2-year has typically kept rising
If market pricing is on the money and the Fed is about to begin another meaningful, albeit relatively small, tightening cycle, history provides a useful guide to how the US 2-year Treasury yield has behaved around the first hike.
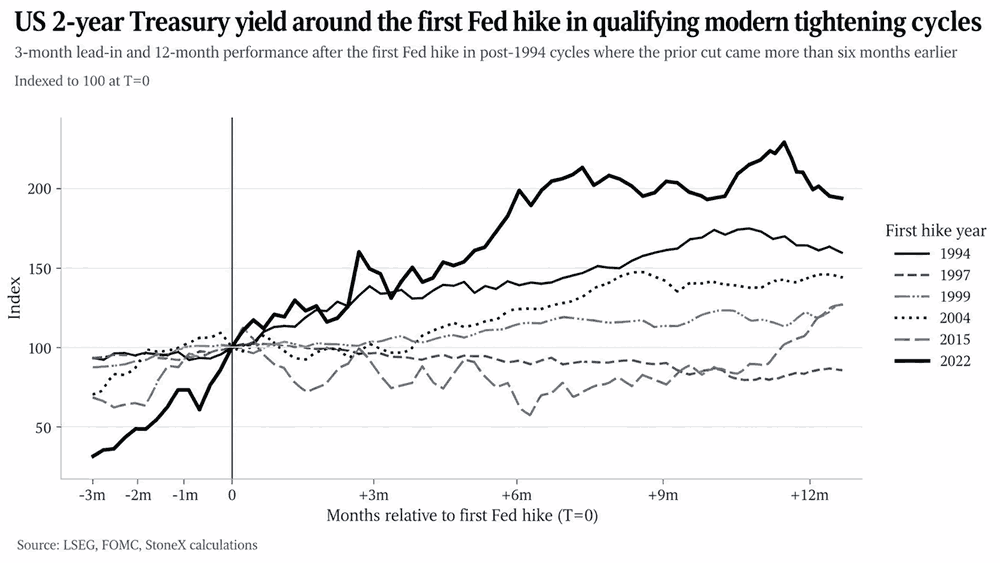
Across all six cycles, the 2-year yield was higher at the time of the first hike than it had been three months earlier, showing that front-end rates had already moved in anticipation of tighter policy.
Source: LSEG
We have seen much the same on this occasion, with the 2-year yield pushing higher into the expected hike as markets moved to price multiple increases.
There was significant dispersion in the performance of the 2-year after the first hike. But in the larger tightening cycles, the direction was generally higher again. The most obvious examples were 1994, 2004 and 2022, where the 2-year continued to rise materially as the Fed hiked aggressively.
DXY has followed very different paths
Source: LSEG
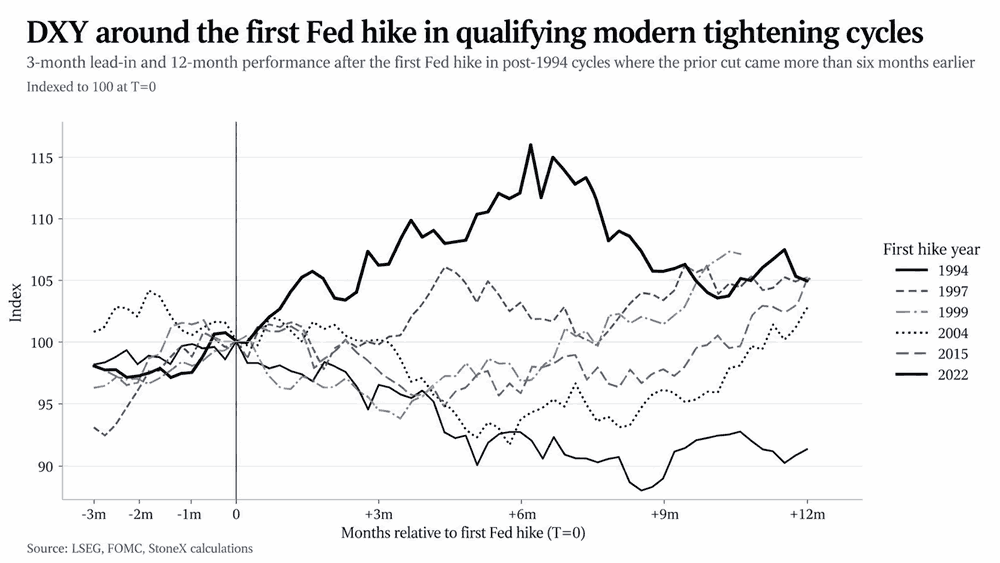
However, while the US dollar generally followed front-end yields higher heading into prior tightening cycles, the historical performance shown in the graphic below varied significantly. On several occasions, DXY weakened even as front-end yields continued to rise, showing that tighter Fed policy and higher short-term rates have not always provided fuel for dollar upside.
The closest historical comparisons
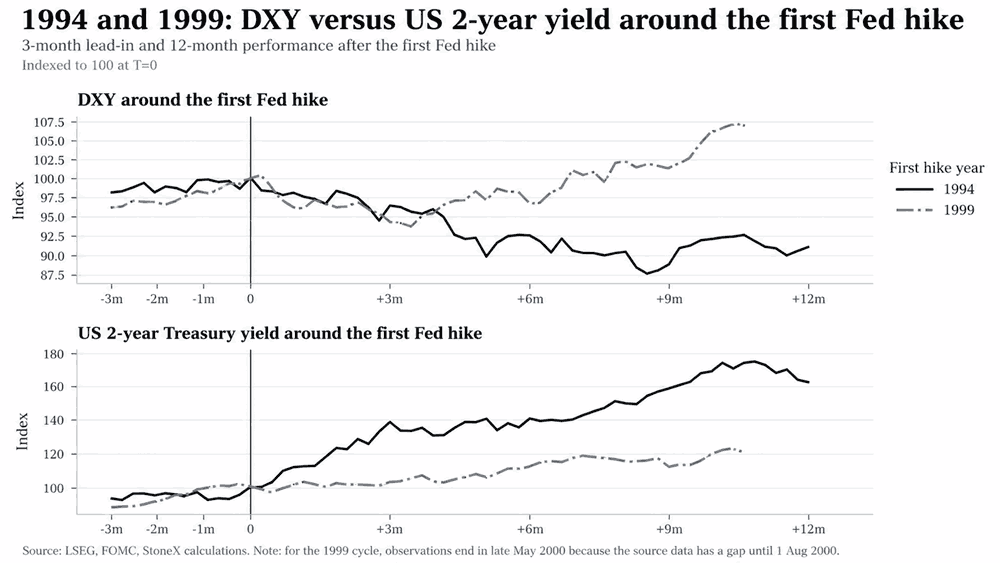
While we’re looking at all modern-day tightening cycles in the analysis above, two look far more relevant to what is currently priced by markets than the others: 1994 and 1999, when the Fed began tightening policy from levels much closer to neutral than the emergency settings seen in 2004, 2015 and 2022.
Source: LSEG
In both cycles, the 2-year yield continued to move higher after the first hike, yet DXY initially went the other way. The divergence was far more pronounced in 1994, when the dollar weakened materially even as the Fed embarked on what ended up being an aggressive tightening cycle.
In 1994, markets increasingly questioned whether the Fed had fallen behind the curve. Even as then-chairman Alan Greenspan delivered what became an aggressive tightening cycle, the bond market was being belted and the dollar still weakened materially, showing that higher rates alone were not enough to support it.
The 1999 episode is arguably more interesting given some of the similarities with today’s environment. The Fed was tightening after a period of insurance cuts, much like we’ve seen with the preceding easing cycle on this occasion, where cuts were delivered amid concern about a deterioration in labour market conditions.
At the same time, the US was in the early stages of a major technological shift as the internet boom gathered pace, accompanied by a huge wave of investment into technology. There are obvious parallels with the current AI build-out, where another burst of technological advancement is driving enormous capital spending and helping shape expectations for growth and productivity.
DXY and front-end rates are tightly linked
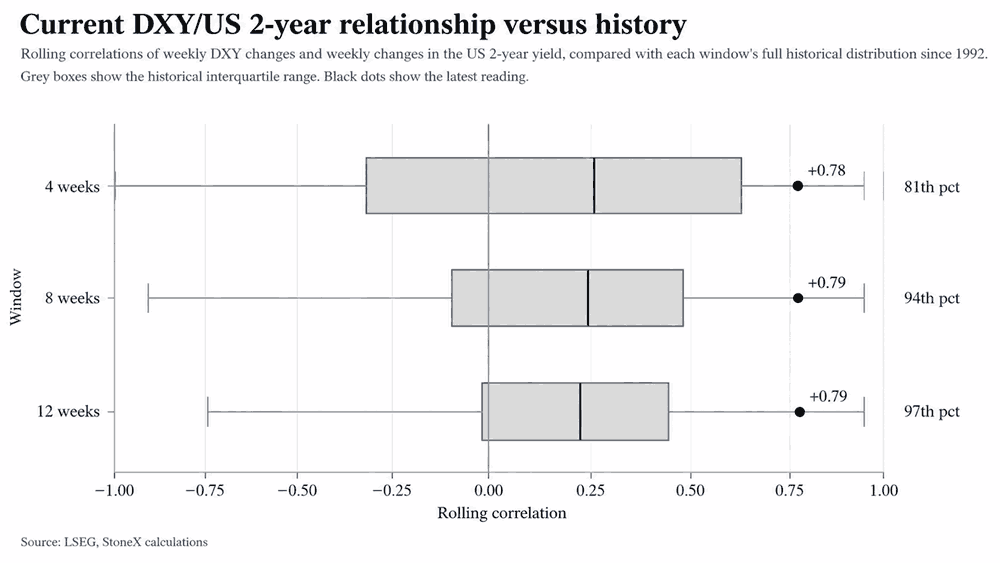
Heading into the start of this likely tightening cycle, we’re seeing an unusually strong positive relationship between front-end US rates and DXY across a range of short to medium-term windows.
The four-week correlation currently sits around +0.78, the eight-week measure around +0.79 and the 12-week reading around +0.79. Going back to 1992, that places the eight-week relationship around the 94th percentile and the 12-week measure around the 97th percentile of all readings.
Source: LSEG
That strong short-term relationship comes even though DXY has weakened heading into the expected first hike while the US 2-year yield has risen. The correlation captures how the two have moved week to week, not their cumulative performance over the period.
Historically, the 2-year yield has typically continued to push higher after the Fed delivered its first hike. If the current relationship were maintained, that would directionally point to upside risk for the dollar as well.
But that is a big assumption to make. Correlations can vary significantly over time, weaken materially and sometimes disappear altogether. Previous tightening cycles provide several examples where front-end yields continued to rise without DXY following in the same direction.
So while the current relationship is unusually tight, it would be highly presumptive to assume it will simply persist if the Fed does begin tightening and the 2-year pushes higher again. History suggests nothing about that relationship is guaranteed.
DXY enters the Fed meeting on firmer footing
Source: TradingView
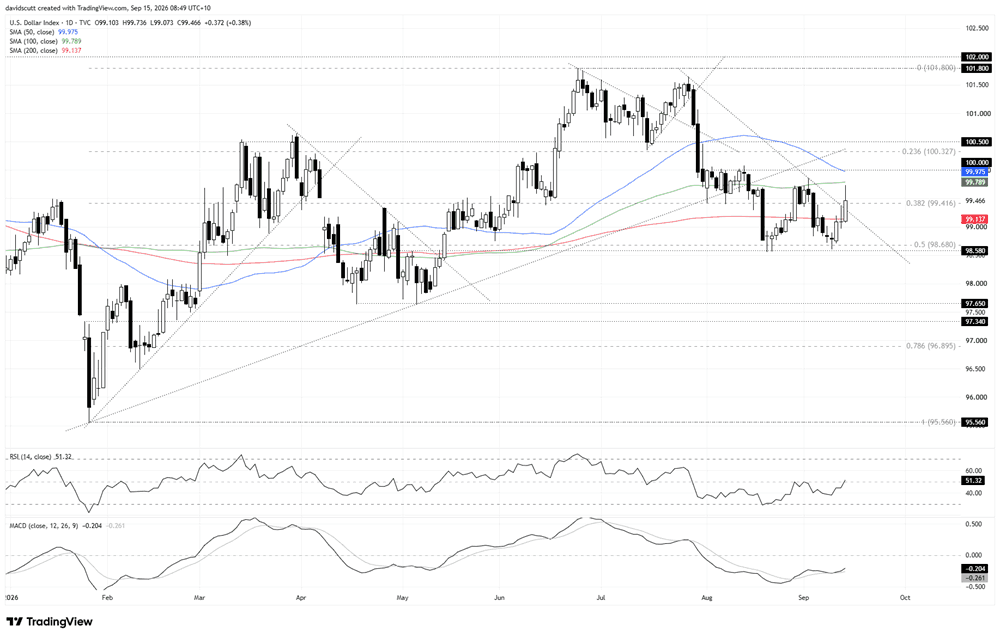
More recently, the technical picture has started to improve, with Monday’s rise in energy prices helping drag Treasury yields and the dollar higher. DXY broke above the 200-day moving average, the late-July downtrend and the 38.2% Fibonacci retracement of the January to June move, suggesting directional risk heading into the Fed meeting may now be skewed sideways to higher.
The 38.2% retracement at 99.42 is a level worth watching when gauging broader directional risk, having acted as both resistance and support for lengthy periods over the course of this year. Overhead, the confluence of the 50-day moving average with the psychologically important 100 level creates the first meaningful upside zone of note. Above that sits 100.50 and the 23.6% retracement of the January to June move, forming another resistance zone to monitor.
Below where DXY currently trades, the area between the 50% retracement of the January to June move and 98.58 has brought out bids both earlier this month and in August. If that zone were to break on the downside, it would point to the potential for a move towards 97.65 and 97.34.
The oscillators also suggest momentum has shifted towards neutral. RSI (14) has been setting higher highs and higher lows and is now back above 50, while MACD has staged a bullish crossover but remains in negative territory.
Taken together, both the price action and oscillators suggest directional risk heading into the Fed meeting is currently skewed sideways to potentially higher.
Latest market news








Web Trader platform
Our sophisticated web-based platform is packed with features.
Open an account today
Experience award-winning platforms with fast and secure execution.
Economic calendar
Related articles

FX Futures Positioning: Dollar Rebound Meets Diverging Forex Bets | COT Report
US dollar longs held firm into Jackson Hole, while euro, yen and commodity FX positioning diverged ahead of ISM and NFP.


Nasdaq 100 Forecast: NDX slips ahead of Fed Chair Warsh’s speech
U.S. stocks are edging lower on Friday, giving back some of yesterday's gains after Nvidia's strong outlook revived the tech trade. The focus has now shifted firmly to Fed Chair Kevin Warsh's Jackson Hole speech, with investors looking for more clarity on the outlook for interest rates.


Bitcoin Forecast: BTC/USD Back to $80K Ahead of Warsh’s Jackson Hole Speech
After surging over $15,000 in the past 10 days alone, there is risk of a near-term pullback if Warsh says anything remotely hawkish at Jackson Hole - what are the levels to watch from here?
