


Gold, silver squeezed by yields as dollar threat lies dormant
Gold and silver are feeling the full force of surging US yields, but the dollar’s failure to join in may be saving them from an absolute drubbing.
Written by
David Scutt
Market Analyst
- Recent yield moves rank among the largest in decades
- Gold and silver weaken as the Treasury curve backs up
- Dollar underperformance may be sparing metals from deeper pain
- Gold coils in falling wedge as silver tests support
US curve takes another beating
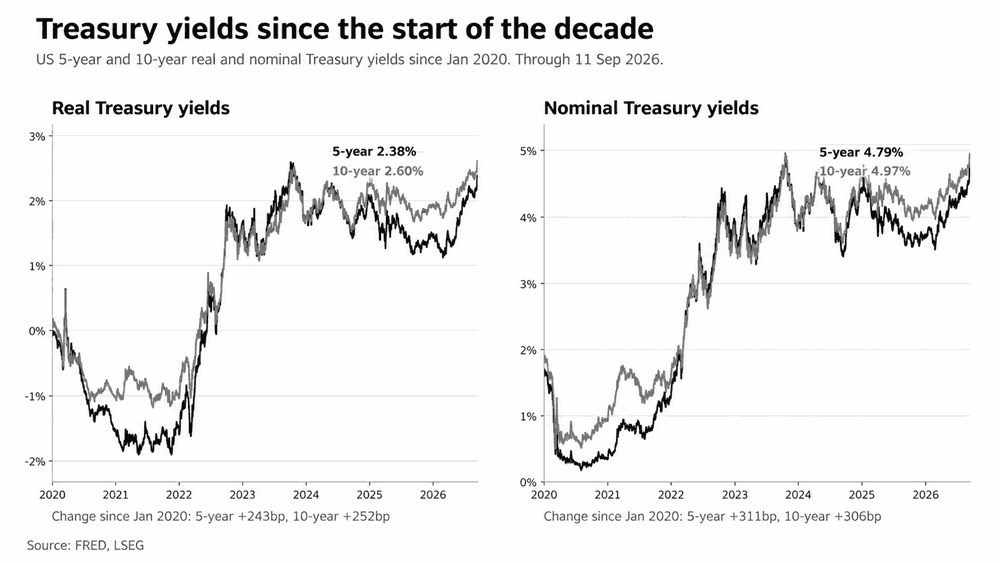
US Treasury yields have backed up hard across both nominal and real curves heading into what’s expected to be the Fed’s first interest rate hike since July 2023.
Ten-year benchmark US yields briefly pushed above 5% overnight, surpassing the highs set in 2023, while benchmark real yields are trading at levels not seen since the GFC. Five-year yields are closing the gap quickly, leaving the belly of the curve taking a serious beating.
Source: LSEG
Normally, that would be a hostile backdrop for non-yielding precious metals. While gold and silver have struggled as yields have surged, what’s more interesting is why both metals remain at historically elevated levels despite it.
Yield surge stands out historically
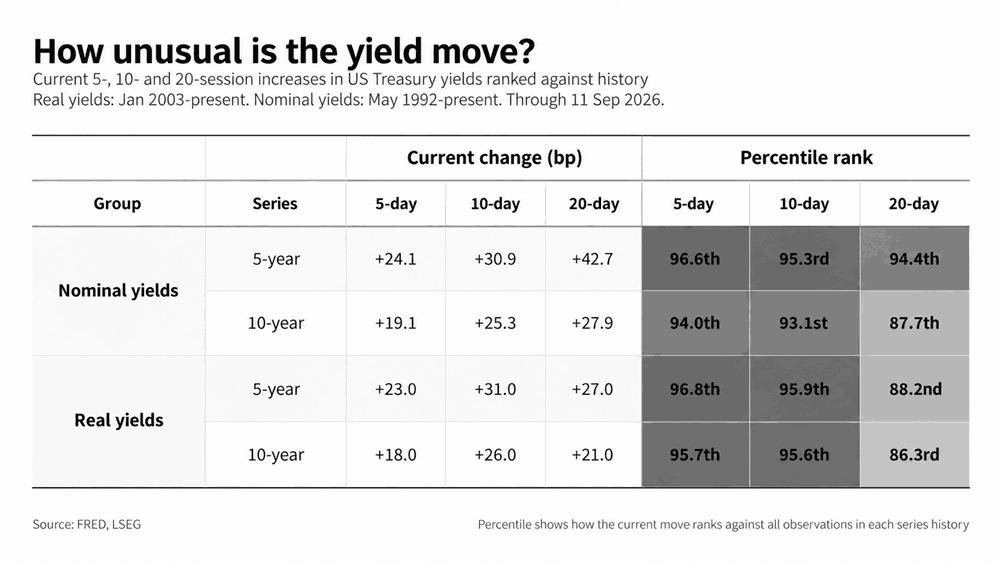
Not only is the outright level of US real and nominal yields elevated elevated to prior decades, but the scale of the recent move has also been significant from a historical perspective. Over the past 10 sessions, five-year real yields have risen by around 31 basis points, placing the move in roughly the 96th percentile of observations going back to 2003. Ten-year real yields are up around 26 basis points over the same period, also ranking around the 96th percentile.
Source: LSEG
Nominal yields have moved sharply as well. Five-year yields have risen by around 31 basis points over 10 sessions, ranking around the 95th percentile of moves seen since 1992, while 10-year yields are up by around 25 basis points, placing the move around the 93rd percentile. That points to a selloff driven primarily by higher real yields rather than a meaningful breakout in market-based inflation expectations.
There’s no single catalyst behind the bond bloodbath. Hawkish Fed repricing is clearly part of it, but so too are fiscal concerns, unease around recent Treasury manoeuvring designed to improve market functioning that may also be helping to suppress long-end yields, and broader geopolitical and policy decisions from the US administration that may be eroding some of the trust built up in US Treasuries over prior decades.
The missing dollar headwind
Given the abrupt shift higher in yields, the weakness in gold and silver is hardly surprising. Over shorter windows, the declines in each have actually been a little larger than the historical norm during comparable yield shocks going back to 2003. What is more unusual is that both remain at historically elevated levels despite the US curve backing up so aggressively.
Part of the answer may come from the US dollar. Over the past 20 sessions, DXY is down by close to 1%, placing its performance in the bottom quintile of comparable historical yield shocks. During similar moves in five-year real and nominal yields, the dollar has typically risen by roughly 1.5% to 2%.
That matters because gold and silver both maintain strong inverse relationships with the dollar. Over the past month, their correlations with DXY sit at around -0.74 and -0.70 respectively, among the strongest negative relationships seen historically. So while higher yields are clearly weighing on both metals, the dollar’s failure to capitalise has likely spared them from even greater pain.
History also suggests the dollar may not necessarily find much relief from the Fed, with our earlier work showing it has often weakened following the first hike of modern tightening cycles.
Gold coils within falling wedge
Source: TradingView
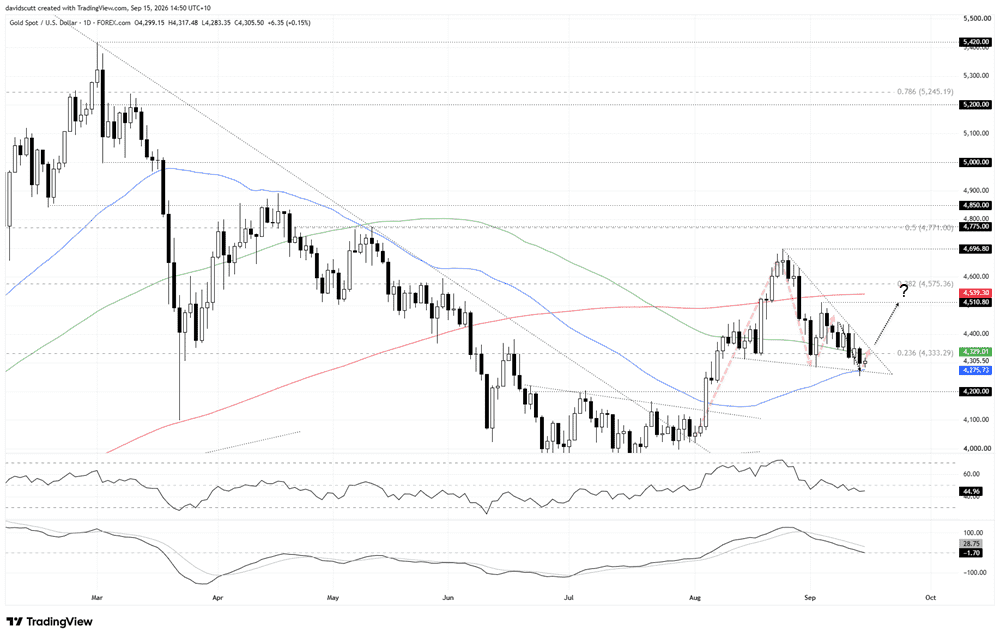
Gold finds itself falling within a falling wedge on the daily chart, a bullish continuation pattern suggesting the rebound from the lows may resume. The structure itself doesn’t guarantee that outcome, making confirmation via a sustained break higher important.
The move lower has been more of a grind than an abrupt selloff, particularly since early September. The price now sits just above the lower side of the structure after finding support on Monday at the 50-day moving average. Looking back over the past year, the 50-day has repeatedly acted as an important level, making it the first one to watch underneath.
Should the price break the top side of the wedge, $4,400 is the first zone to watch given the struggles above it last week, followed by $4,510.80, marking the high set earlier this month. Above $4,510.80, the 200-day moving average is the next level to watch, followed by the 38.2% Fib retracement of the January to June bear move at $4,575 an ounce.
Overhead, $4,696.80 comes into view, marking the August high. A break above that level would build confidence that the rally from the June lows is resuming. On the downside, a break beneath the 50-day moving average would bring $4,200 into focus, marking the top of the breakout zone shattered in early August.
The message from the oscillators is more neutral than outright bullish or bearish. RSI (14) has flattened just beneath 50, while MACD has crossed its signal line and moved slightly negative. Neither, however, points to an immediate substantial pickup in downside momentum.
Silver support in focus
Source: TradingView
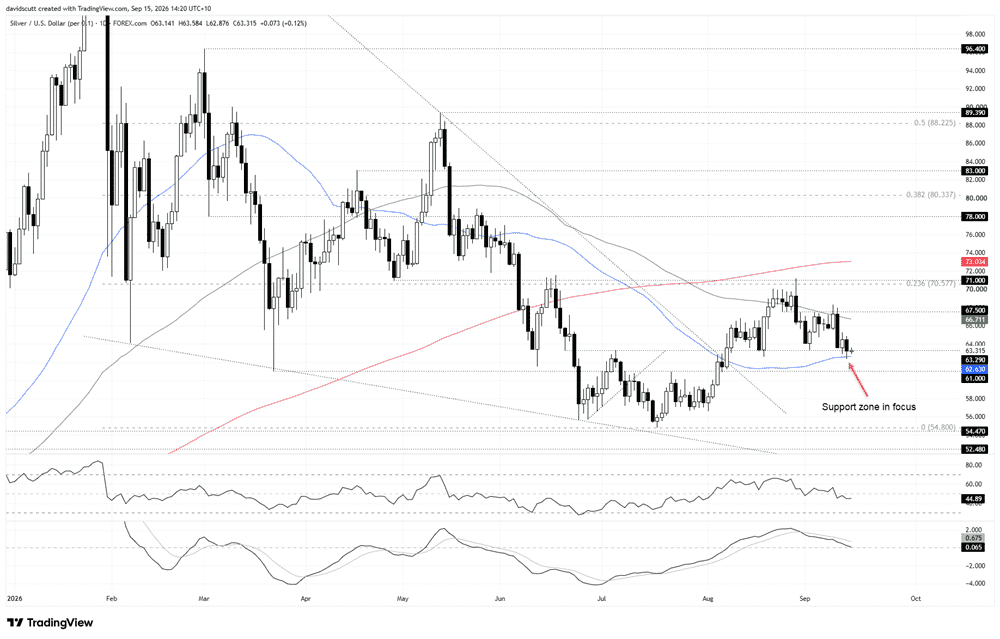
Silver looks heavy on the daily chart, currently testing $63.29, a level that has repeatedly acted as support and resistance going back to June. The 50-day moving average sits in close proximity, with the price having bounced from it on Monday.
A clean break beneath that zone would strengthen the bearish case and bring $61 into view. Beneath that, $57 would be the next level to watch, followed by the July low at $54.80.
Should the support zone hold, the 100-day moving average and $67.50 are the first levels to watch on the topside. Overhead, the 23.6% Fib retracement of the January to July bear move sits around $71, before the 200-day moving average just above $73.
Like gold, the message from the oscillators is neutral. RSI (14) is meandering lower just beneath 50, while MACD is on the cusp of turning negative after already crossing its signal line from above.
Momentum is with neither the bulls nor bears, putting increased emphasis on the price action.
Latest market news









Web Trader platform
Our sophisticated web-based platform is packed with features.
Open an account today
Experience award-winning platforms with fast and secure execution.
Economic calendar
Related articles

FX Futures Positioning: Dollar Rebound Meets Diverging Forex Bets | COT Report
US dollar longs held firm into Jackson Hole, while euro, yen and commodity FX positioning diverged ahead of ISM and NFP.


Gold and S&P 500 analysis: What now after Warsh’s hawkish speech?
The dollar surged across the board after the Fed Chair Kevin Warsh surprised with a hawkish-leaning speech at the Jackson Hole summit. All the bearish dollar bets that had been accumulated since last Friday on the back of data weakness and bond market troubles had to be squared and that triggered a short squeeze rally for the dollar. Gold and silver dropped, as a result, as too did bitcoin, while US indices were giving back earlier gains.

Nasdaq 100 Forecast: NDX slips ahead of Fed Chair Warsh’s speech
U.S. stocks are edging lower on Friday, giving back some of yesterday's gains after Nvidia's strong outlook revived the tech trade. The focus has now shifted firmly to Fed Chair Kevin Warsh's Jackson Hole speech, with investors looking for more clarity on the outlook for interest rates.
