

Gold, Silver, DXY Outlook: Charts Test Defining Support Levels
Gold, Silver, DXY Outlook: Charts test defining support levels as crude oil prices hold above $100, U.S. Treasury yields move higher and hawkish FOMC risks come into focus. Key scenarios to watch.
Written by
Razan Hilal
Market Analyst
Gold, silver and the U.S. dollar are testing defining technical levels as crude oil prices hold above $100, U.S. Treasury yields push higher and the risk of a hawkish FOMC decision increases.
Key developments in focus include:
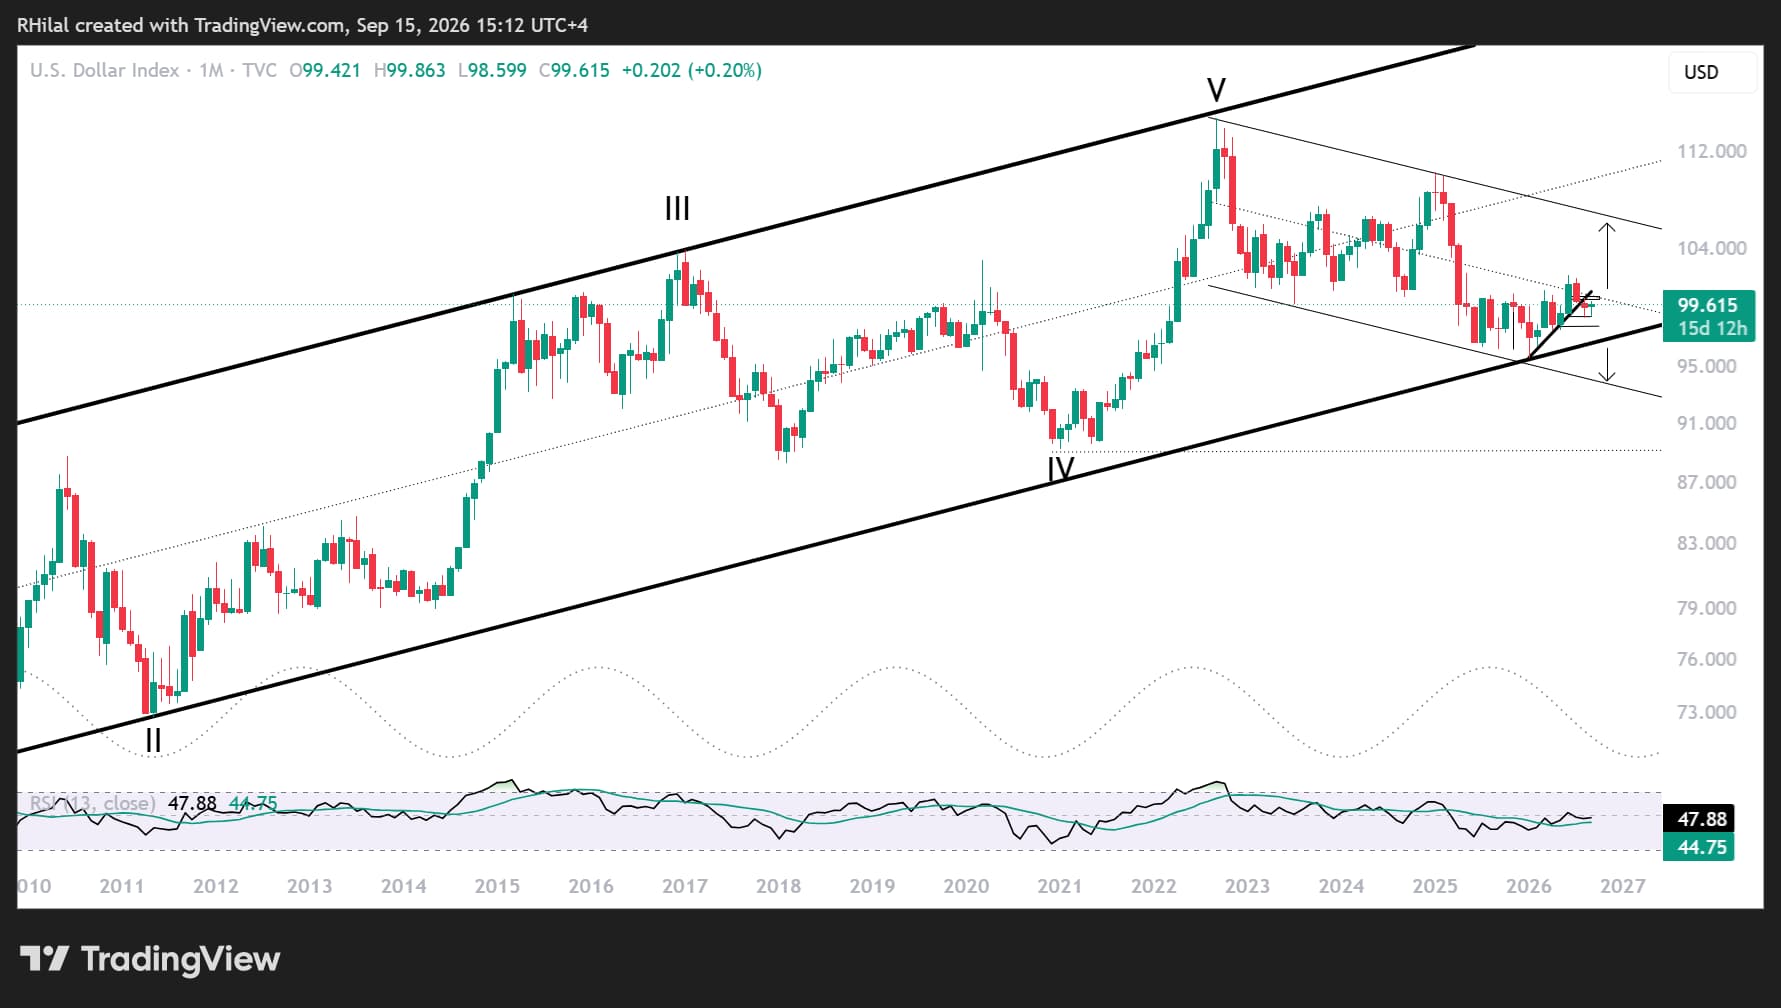
- The dollar’s breakdown below its 2026 uptrend, while it simultaneously approaches the boundaries of its 18-year uptrend.
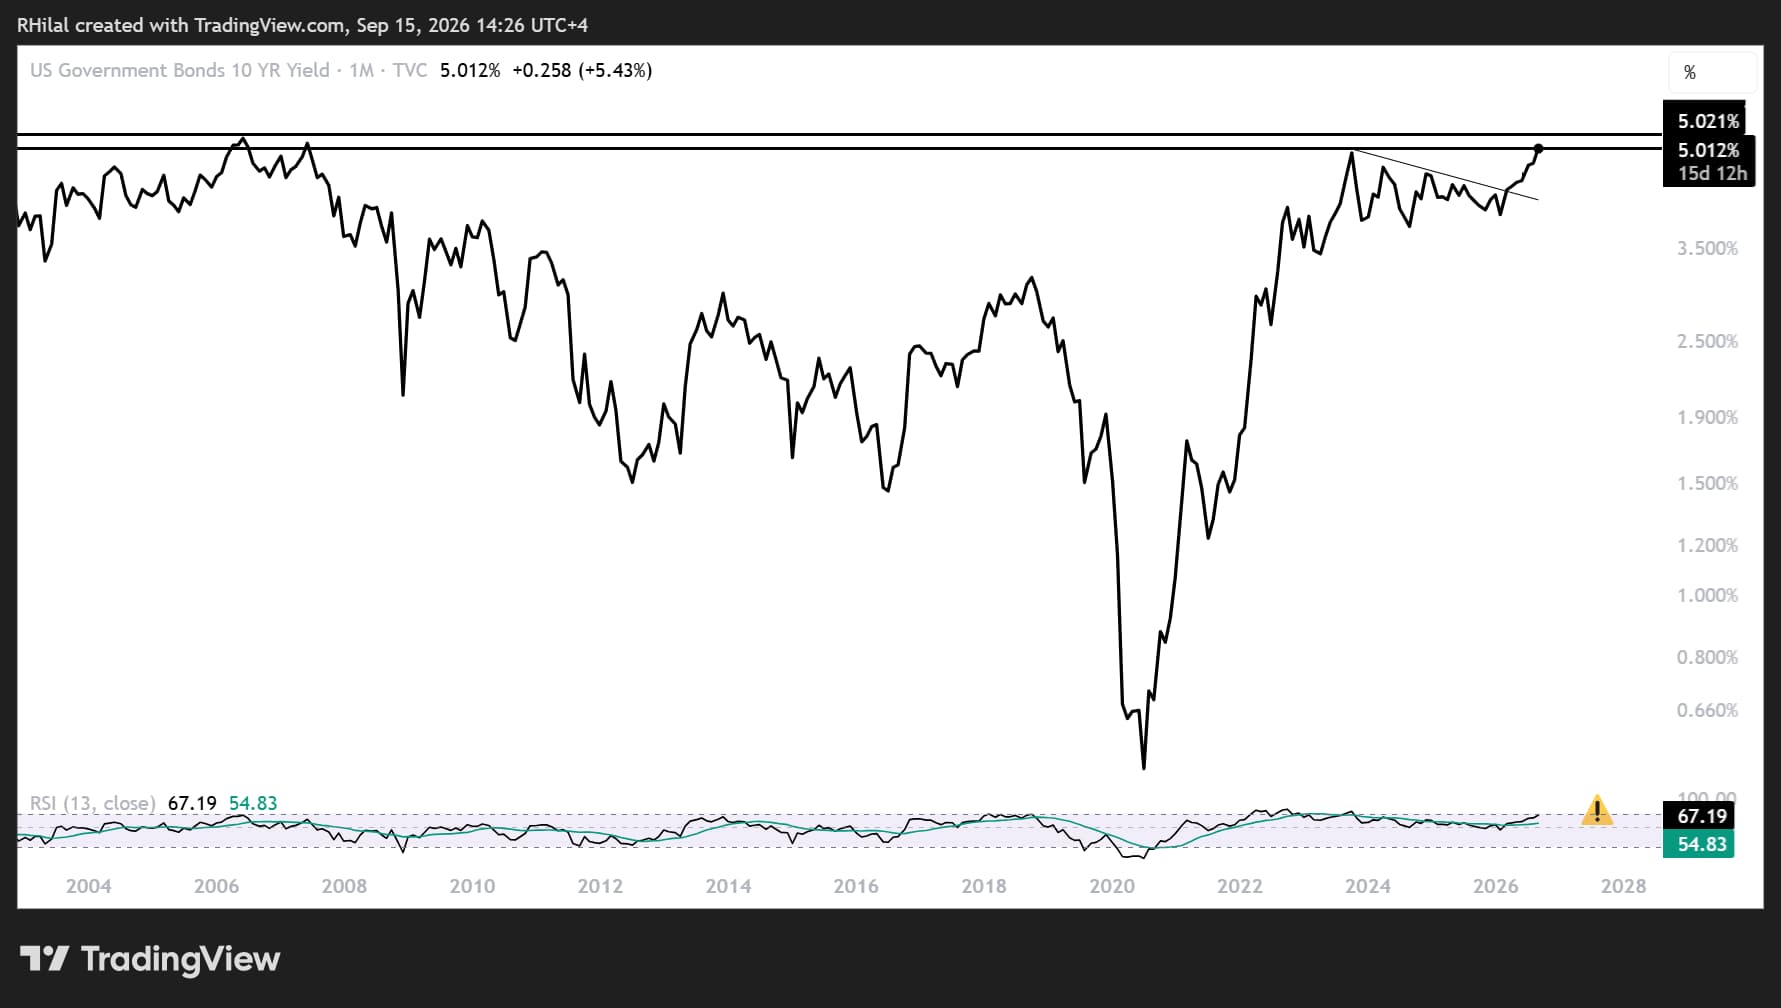
- The U.S. 10-year Treasury yield is officially testing highs last seen in 2007, supporting dollar pairs and capping gains across broader markets.
- Gold and silver are facing fundamental pressure from rising bond yields and hawkish Federal Reserve rate expectations, alongside technical risks of breakdowns below 4,230 and 61, respectively.
DXY Monthly Outlook — Log Scale
Source: TradingView
Despite the DXY breaking below its 2026 uptrend and signaling short-term weakness, the longer-term structure remains tilted to the upside.
The key downside levels I am watching align with the Fibonacci retracement levels of the 2026 uptrend at 98.50, 98, 97 and 95.50. The 95.50 area represents the defining barrier between a structural breakdown of the 18-year uptrend and a potential continuation of the longer-term bullish structure.
On the upside, reclaiming the 2026 uptrend near 100.30, followed by a move above 101 and 101.70, would restore the dollar’s strength against major markets. Such a move could lift the DXY toward new 2026 highs and add further pressure on precious metals.
Gold Daily Outlook — Log Scale
Source: TradingView
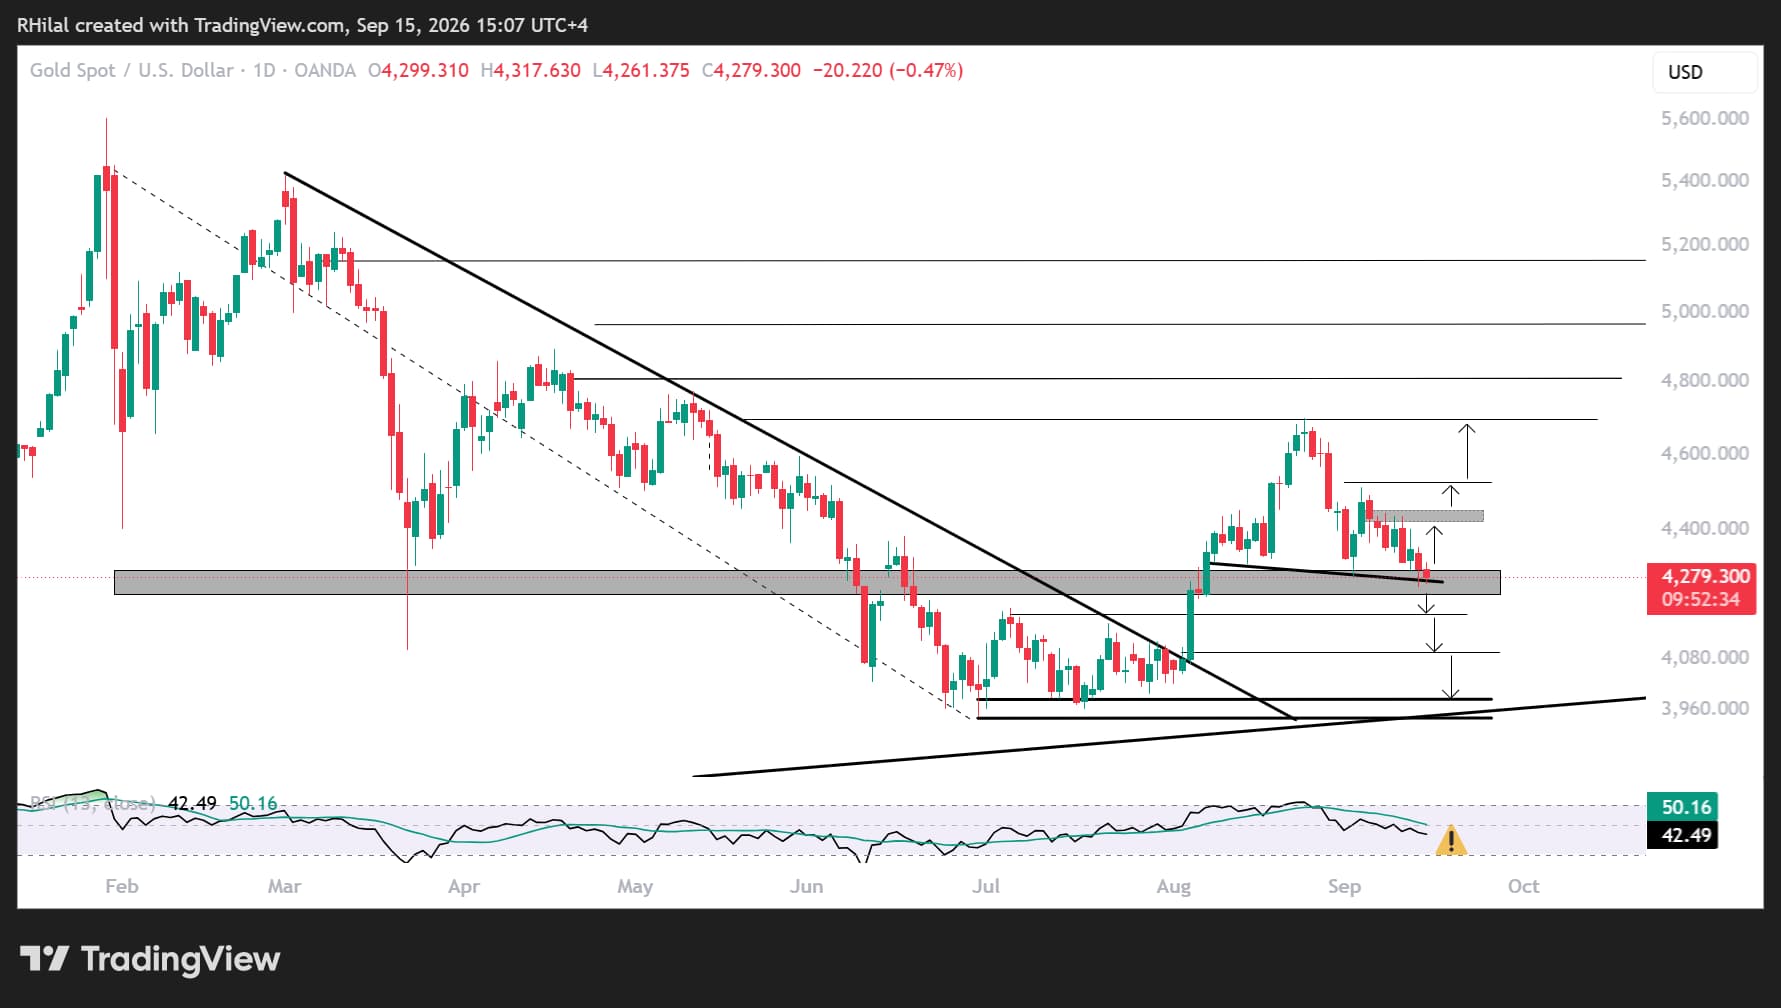
From a daily perspective, gold is trading in bullish territory after moving beyond the descending resistance that defined the broader bearish bias between January and August 2026. Price action is also holding above the 4,230 support zone.
This support zone acts as a defining barrier between the bullish and bearish scenarios. It may also represent the neckline of a potential head-and-shoulders pattern developing since the beginning of August across both the gold and silver charts.
Gold Bullish Scenario
A sustained hold above 4,230, followed by consecutive closes above 4,420 and 4,450, would redirect the bullish scenario toward 4,520 and 4,700, respectively.
The 4,700 level aligns with the 50% Fibonacci retracement of the January–August decline, making it an important threshold for determining whether the current recovery can develop into a broader advance.
A sustained move above 4,700 would expose:
- 4,880: 61.8% Fibonacci retracement.
- 5,130: 78.6% Fibonacci retracement.
- 5,460: 100% retracement and the final major technical test before confidence in a longer-term bullish continuation strengthens considerably.
At the same time, the daily RSI continues to push deeper into oversold territory on the hourly time frames, while remaining in bearish territory on the daily time frame.
This does not invalidate the bullish set up, but it does increase the probability of short-term consolidation or a corrective pullback before another potential rebound.
Gold Bearish Scenario
On the downside, a break below 4,240 would weaken short-term momentum and expose the 4,120–3,960 region as another potential dip-buying zone.
Should this area fail to hold, gold could trace another 500-point drawdown toward the market-consensus zone near 3,500–3,400, creating another major potential turning point.
These longer-term support zones could provide significant reversal opportunities if a deeper correction develops.
As long as the U.S. Dollar Index and crude oil remain firm, volatility and downside risks across currencies and precious metals are likely to remain elevated.
Silver Daily Outlook — Log Scale
Source: TradingView
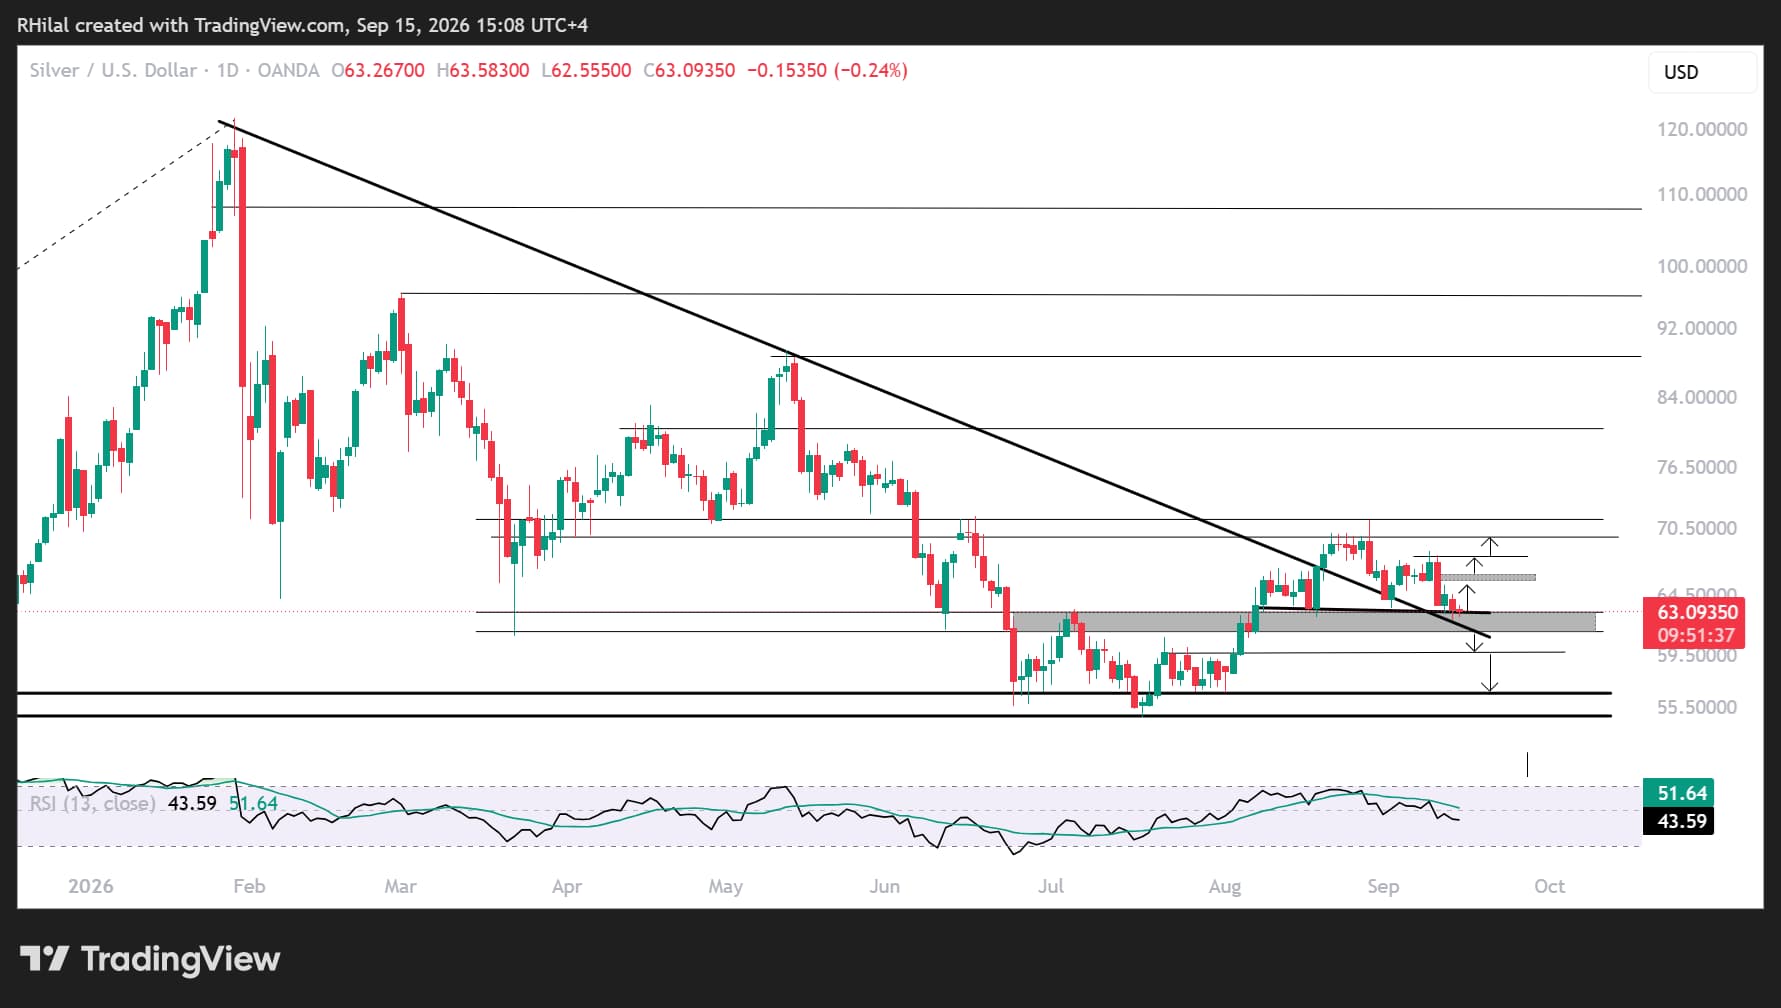
From a daily perspective, silver is also trading in bullish territory after moving beyond the descending resistance that defined the broader bearish bias between January and August 2026. Price action is holding above the 61 support zone.
This support zone acts as a defining barrier between the bullish and bearish scenarios. It may also represent the neckline of a potential head-and-shoulders pattern developing since the beginning of August across both the gold and silver charts.
The daily RSI is showing a similar configuration, pushing deeper into oversold territory on the hourly time frames while remaining in bearish territory on the daily time frame.
Silver Bullish Scenario
A sustained breakout above $66 would strengthen the bullish recovery and expose the next Fibonacci resistance levels:
- $68: 38.2% retracement.
- $69.70: 50% retracement.
- $71.40: 61.8% retracement.
The $72 region would represent the final major technical test before confidence in a broader long-term bullish continuation strengthens.
Silver Bearish Scenario
On the downside, a break back below the $61 support level would signal a deterioration in short-term momentum and increase the risk of a retest of the 2026 lows near $59.60 and $54.90–$55.
A sustained breakdown below $54.90 would expose the longer-term $50–$46 support region. This area aligns with the October 2025 low, a multi-decade resistance zone that turned into support between 1980 and 2025, and the 61.8% retracement of the advance from the 1930 low to the 2026 high.
Given the significance of this multi-decade technical confluence, the region could become an important area to monitor for stabilization if a deeper silver correction unfolds.
Confirmation is needed through either a rebound or a breakdown before confirming the next potential scenario, particularly as the 10-year Treasury yield tests significant resistance at the 2007 high and Brent crude tests 7-month resistance near $108.
US 10Y Treasury Yield - Monthly Time Frame - Log Scale
Source: Trading view
A fine line remains between a potential market rebound and a broader sell-off.
Written by Razan Hilal, CMT
Follow on X: @Rh_waves
Latest market news











Web Trader platform
Our sophisticated web-based platform is packed with features.
Open an account today
Experience award-winning platforms with fast and secure execution.
Economic calendar
Related articles

Gold and S&P 500 analysis: What now after Warsh’s hawkish speech?
The dollar surged across the board after the Fed Chair Kevin Warsh surprised with a hawkish-leaning speech at the Jackson Hole summit. All the bearish dollar bets that had been accumulated since last Friday on the back of data weakness and bond market troubles had to be squared and that triggered a short squeeze rally for the dollar. Gold and silver dropped, as a result, as too did bitcoin, while US indices were giving back earlier gains.


Bitcoin Forecast: BTC/USD Back to $80K Ahead of Warsh’s Jackson Hole Speech
After surging over $15,000 in the past 10 days alone, there is risk of a near-term pullback if Warsh says anything remotely hawkish at Jackson Hole - what are the levels to watch from here?


Gold Falters at Resistance, Grappling With PCE, Month-End Flows and Jackson Hole
Gold has pulled back from resistance after sticky PCE data, with month-end flows and Jackson Hole now shaping the near-term outlook.
