


GBPUSD Forecast Pound Sterling loses ground after NFP release
The week ends with GBP/USD down around -0.6%, reflecting a clear loss of short-term momentum in the pound sterling. At the same time, the US dollar is showing renewed stability and continues to hold a stronger demand bias against its main rivals.
Written by
Julian Pineda
Market Analyst
The week ends with GBP/USD down around -0.6%, reflecting a clear loss of short-term momentum in the pound sterling. At the same time, the US dollar is showing renewed stability and continues to hold a stronger demand bias against its main rivals.
Part of the current selling pressure is linked to the release of US NFP data, which revived dollar strength and could keep meaningful selling pressure in GBP/USD over the coming trading sessions.

Does NFP favor the US dollar?
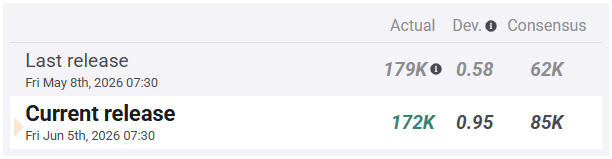
During today’s session, the United States released its NFP employment data. The official figure came in at 172,000 new jobs created in May, well above the 85,000 forecast, once again showing that the US labor market remains stronger than expected in the short term.
Source: FXSTREET
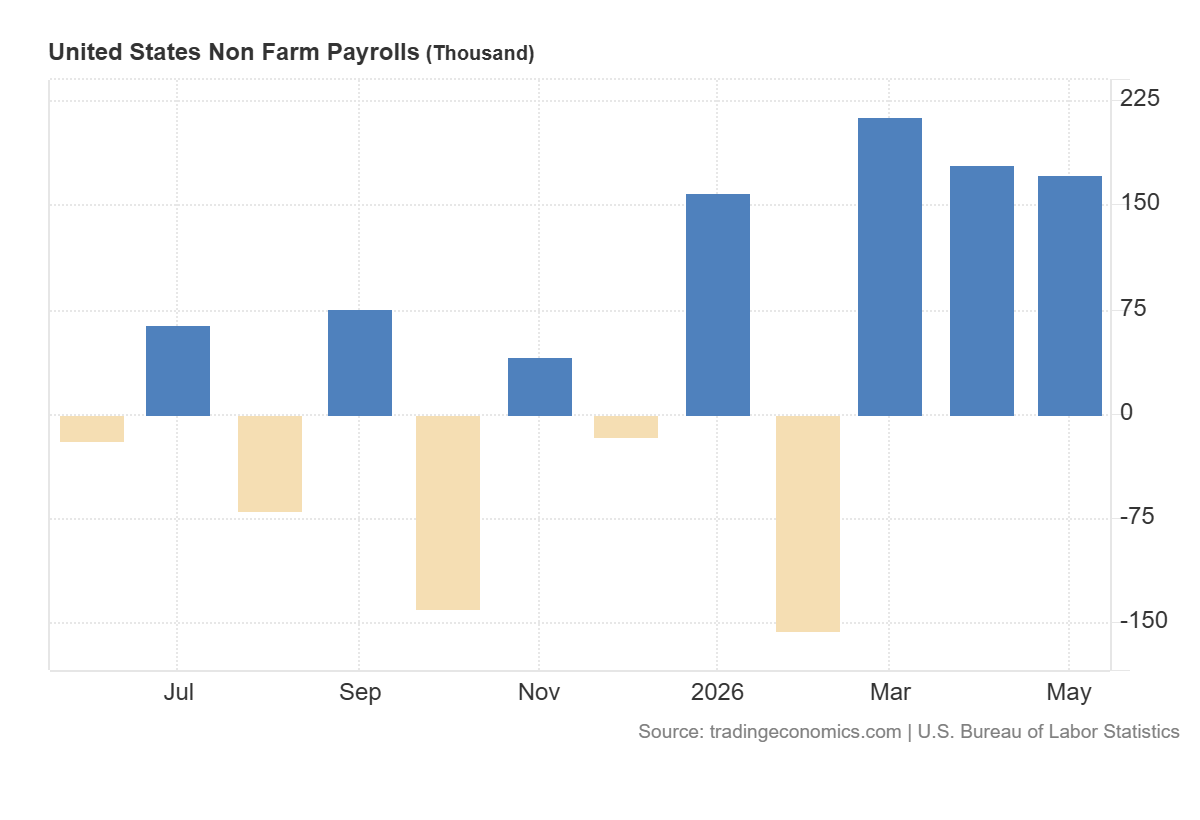
This result is starting to shift market perception around US employment. Although February’s data showed a slowdown of -156,000 jobs, the following three readings have remained consistently above 170,000 new jobs per month. This points to a more resilient labor market during the first part of 2026, even stronger than several positive readings seen during the second half of 2025.
Source: TradingEconomics
The data is important because a solid labor market can change expectations around the Federal Reserve. Stronger employment could add to inflation concerns, but it may also show that the US economy has more room to withstand a more restrictive monetary policy stance over the next few months.
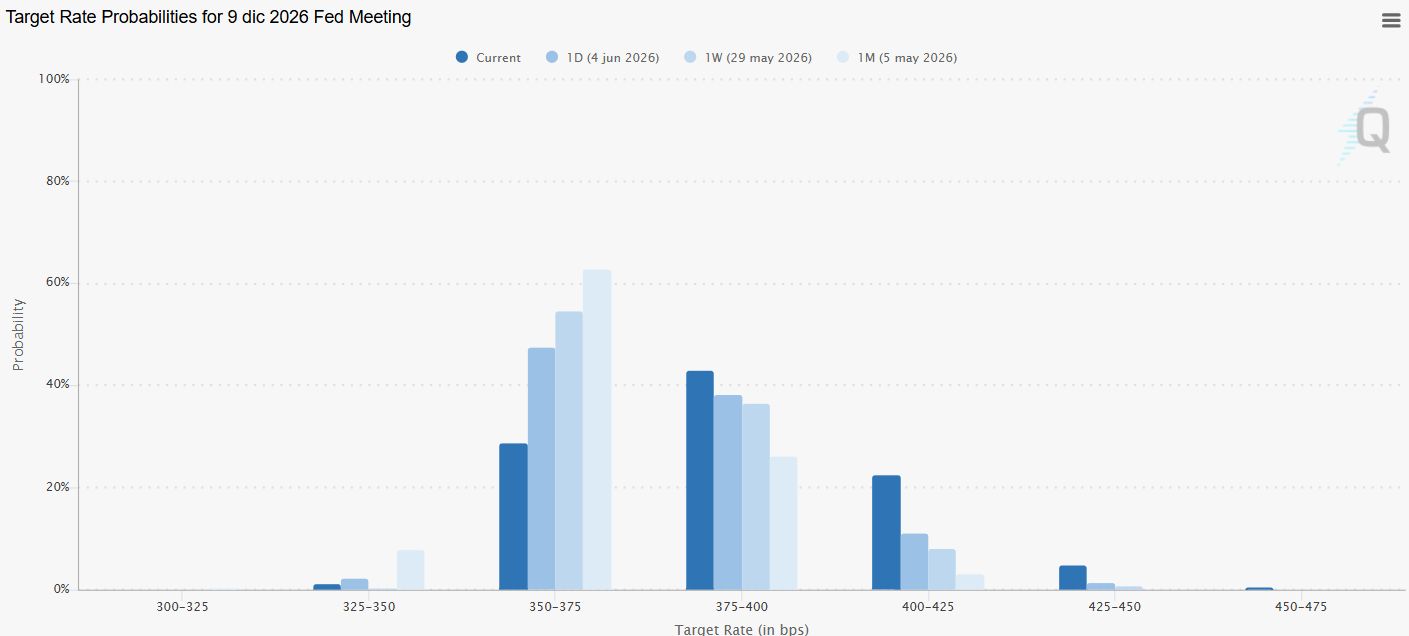
This shift is already visible in central bank probability expectations. After the employment data was released, the probability of a rate hike in December rose above 42%, with markets now considering a possible move from the current 3.75% level toward a new reference near 4.00%. This is relevant when compared with the 26% probability seen a month ago, suggesting that markets are starting to price in a more aggressive Fed earlier than previously expected.
Source: CMEGROUP
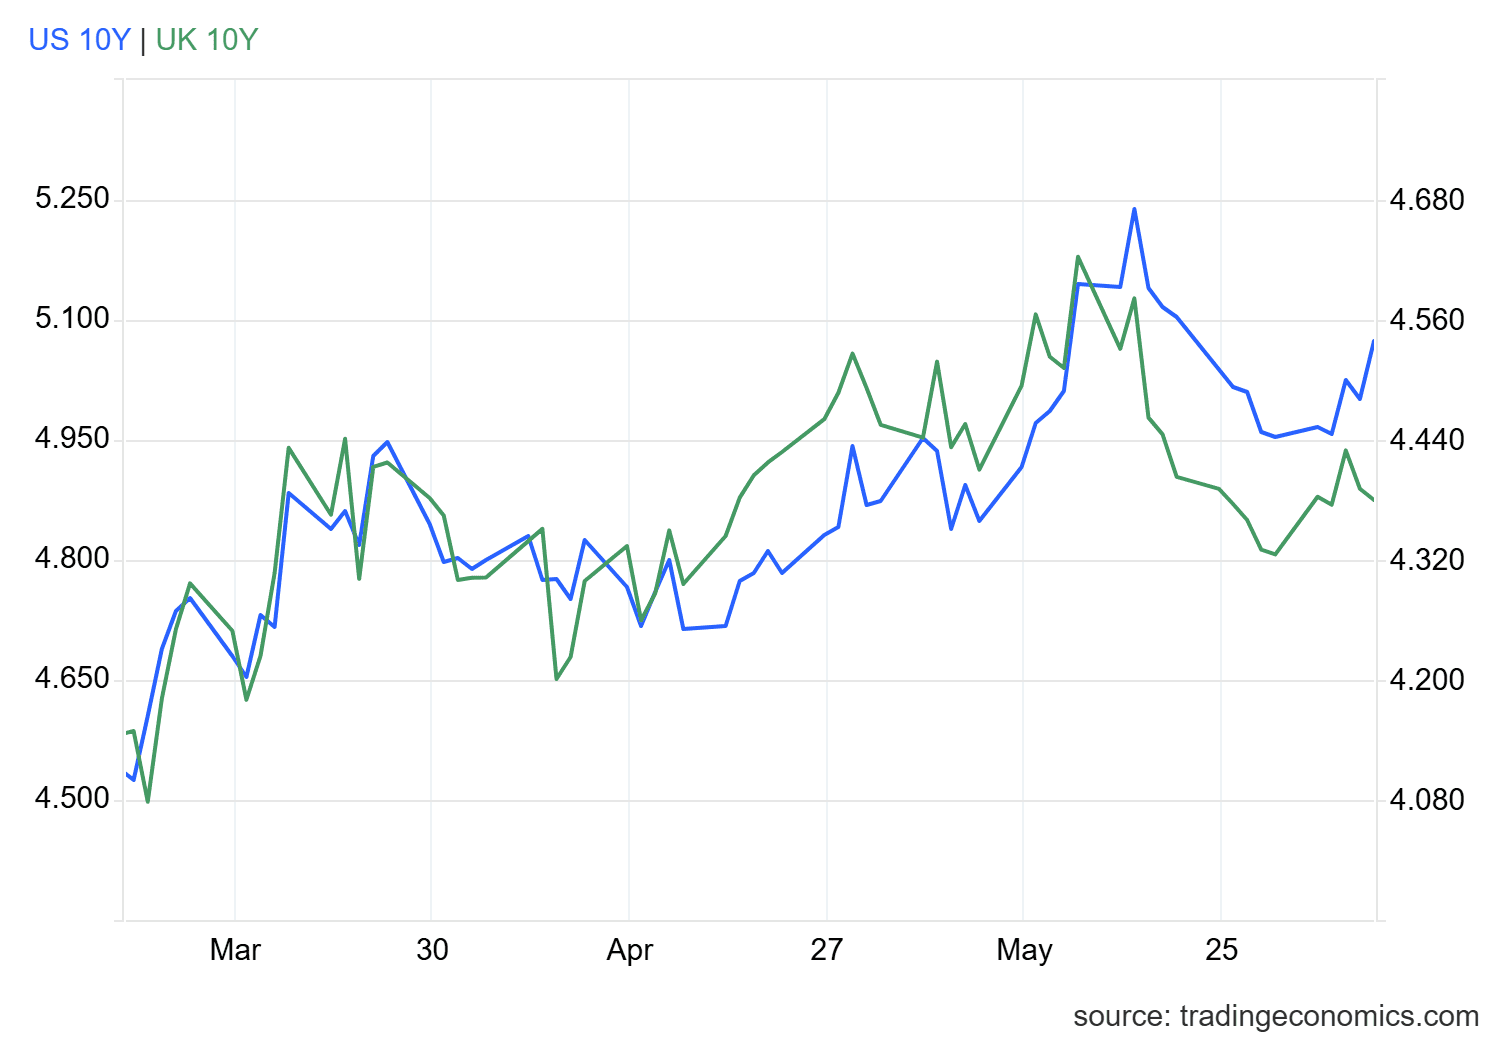
This change in expectations has also affected the bond market. The US 10-year Treasury yield posted a new increase of more than 1.2% during the session and moved back above the 4.5% reference area. This contrasts with UK 10-year bonds, which remained close to 4.8% but fell around -0.3% on the day. For now, this highlights the recovery in US yields compared with short-term weakness in UK bonds.
Source: TradingEconomics
This dynamic matters for US dollar strength. US Treasuries are usually perceived as safer than UK bonds, so a narrowing yield differential between both markets can increase the appeal of dollar-denominated assets. This may support demand for USD and make it harder for the pound sterling to recover ground consistently.
For this reason, if this fundamental backdrop remains in place, selling pressure could continue to be relevant in GBP/USD over the coming sessions.
Technical outlook for GBP/USD
Source: StoneX, Tradingview
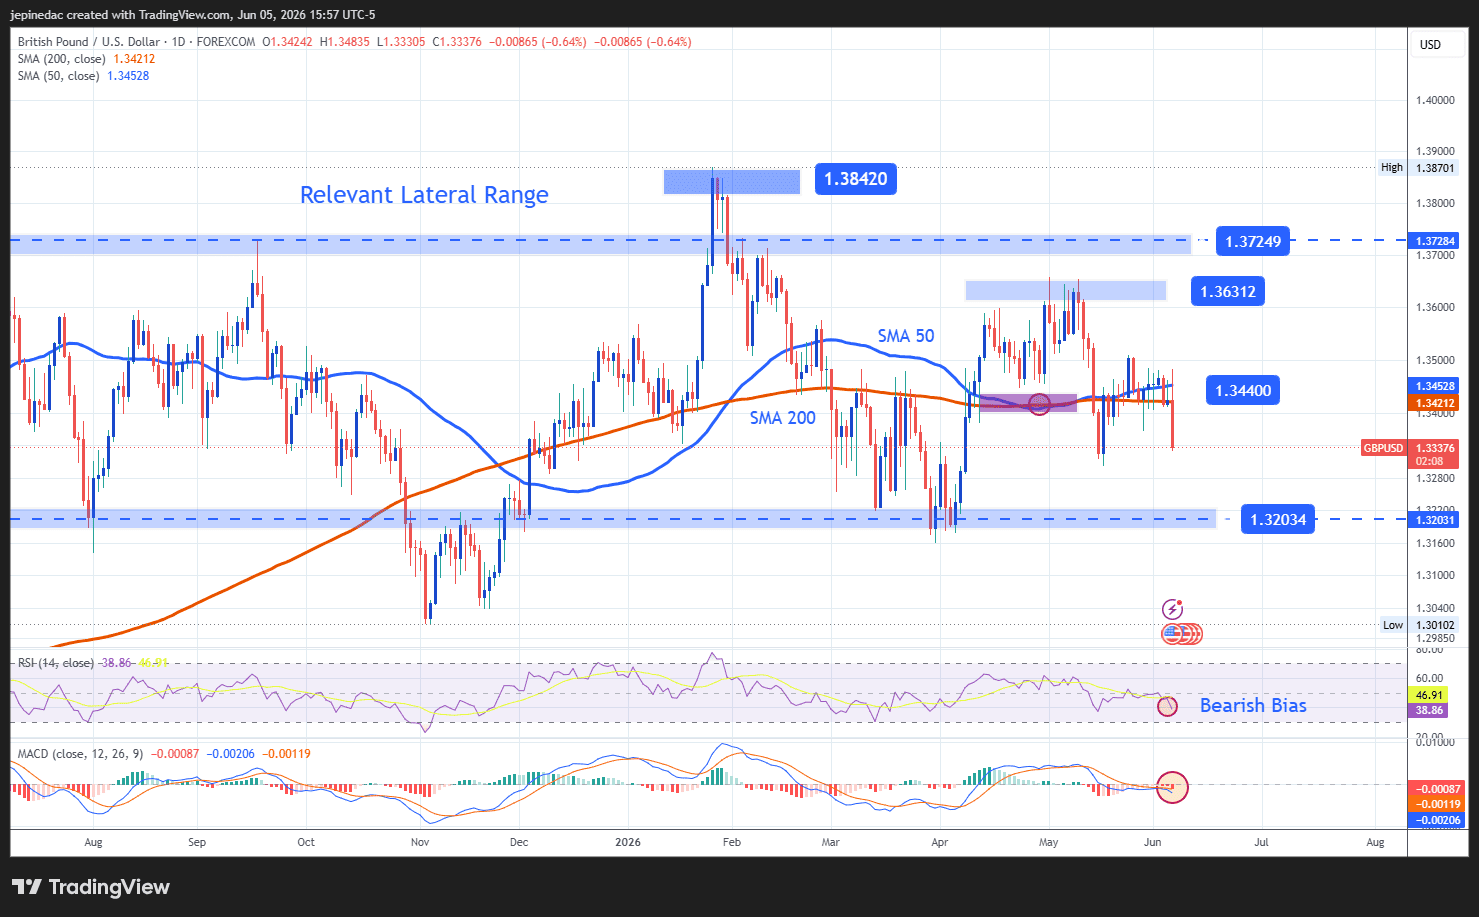
- The broad sideways range continues to dominate: Despite recent selling pressure on the GBP/USD daily chart, the most relevant structure remains the wide sideways range that has dominated in recent months, with the upper boundary near 1.37249 and the lower boundary around 1.32034. While these two levels remain in place, it may be difficult to see a more structured trendline develop over the coming weeks.
- RSI: Now, the RSI has started to move clearly below the neutral 50 level, suggesting that selling momentum is beginning to dominate the short-term chart. If the indicator continues to move this way, bearish pressure could remain relevant over the coming sessions.
- MACD: A similar setup can be seen in the MACD, as the histogram continues to move below the neutral 0 line. This suggests that the average strength of short-term moving averages shows consistent weakness and highlights the importance of the recent selling pressure.
Key levels:
- 1.36312 – Relevant resistance: The most important nearby high in the short term and the main upside barrier to watch. A move back toward this area could begin to reactivate a buying bias over the following sessions.
- 1.34400 – Near-term barrier: A relevant neutral zone that coincides with the 50- and 200-period moving averages. Price action that remains too close to this level could point to a more consistent phase of indecision and keep the broad sideways range in place over the medium term.
- 1.32034 – Crucial support: A low that coincides with the lower boundary of the wide sideways range. Consistent moves below this level would start to reflect a dominant selling bias and could open the door to the formation of a short-term bearish trendline over the following weeks.
Written by Julian Pineda, CFA, CMT – Market Analyst
Follow him on: @julianpineda25







Web Trader platform
Our sophisticated web-based platform is packed with features.
Open an account today
Experience award-winning platforms with fast and secure execution.
Economic calendar
Related articles

USD/JPY weekly outlook: Payrolls may challenge the Fed’s hawkish reset
USD/JPY has finally woken from its slumber. Payrolls now loom as the key test of whether the latest hawkish repricing sticks or sinks.

Euro Short-term Outlook: EUR/USD Pullback Nears Pivotal Uptrend Support 8 28 2026
Warsh's comments accelerated the EUR/USD selloff, raising the stakes as buyers look to stabilize the broader recovery.


EUR/USD forecast: All eyes on Warsh at Jackson Hole - Forex Friday
For much of this week, the EUR/USD has been edging lower with the US dollar regaining some ground after last week’s sell-off that was triggered, in part, by the bond market worries. Investors have been unwilling to bet further against the US dollar so far this week ahead of Kevin Warsh’s keynote speech at the Jackson Hole summit, due later today.
