


US Dollar Breaks Bull Flag Into FOMC: EUR/USD, USD/JPY, GBP/USD
USD bulls have continued to run and it was the June FOMC meeting that caused the prior break. For next week the Fed is back in the spotlight, along with the BoJ and BoE.
Written by
James Stanley
Sr. Strategist
US Dollar Talking Points:
- The US Dollar retains a bullish look from weekly, daily and four-hour charts and next week brings the FOMC, which helped to fire the current rally back in June when they sounded more hawkish than expected.
- Next week also brings the BoE and BoJ, and USD/JPY has been a large component of that USD breakout of late as the pair has pushed to fresh 40-year highs.
US Dollar
The FOMC rate decision in June is what finally helped USD bulls to take a big step forward and from the weekly chart, that move is still quite evident although it started to stall shortly after running into the Fibonacci level at 101.80.
Since then, the pullback retained structure as shown by a bull flag formation, and that led into topside breakout this week after the European Central Bank rate decision.
US Dollar Daily Chart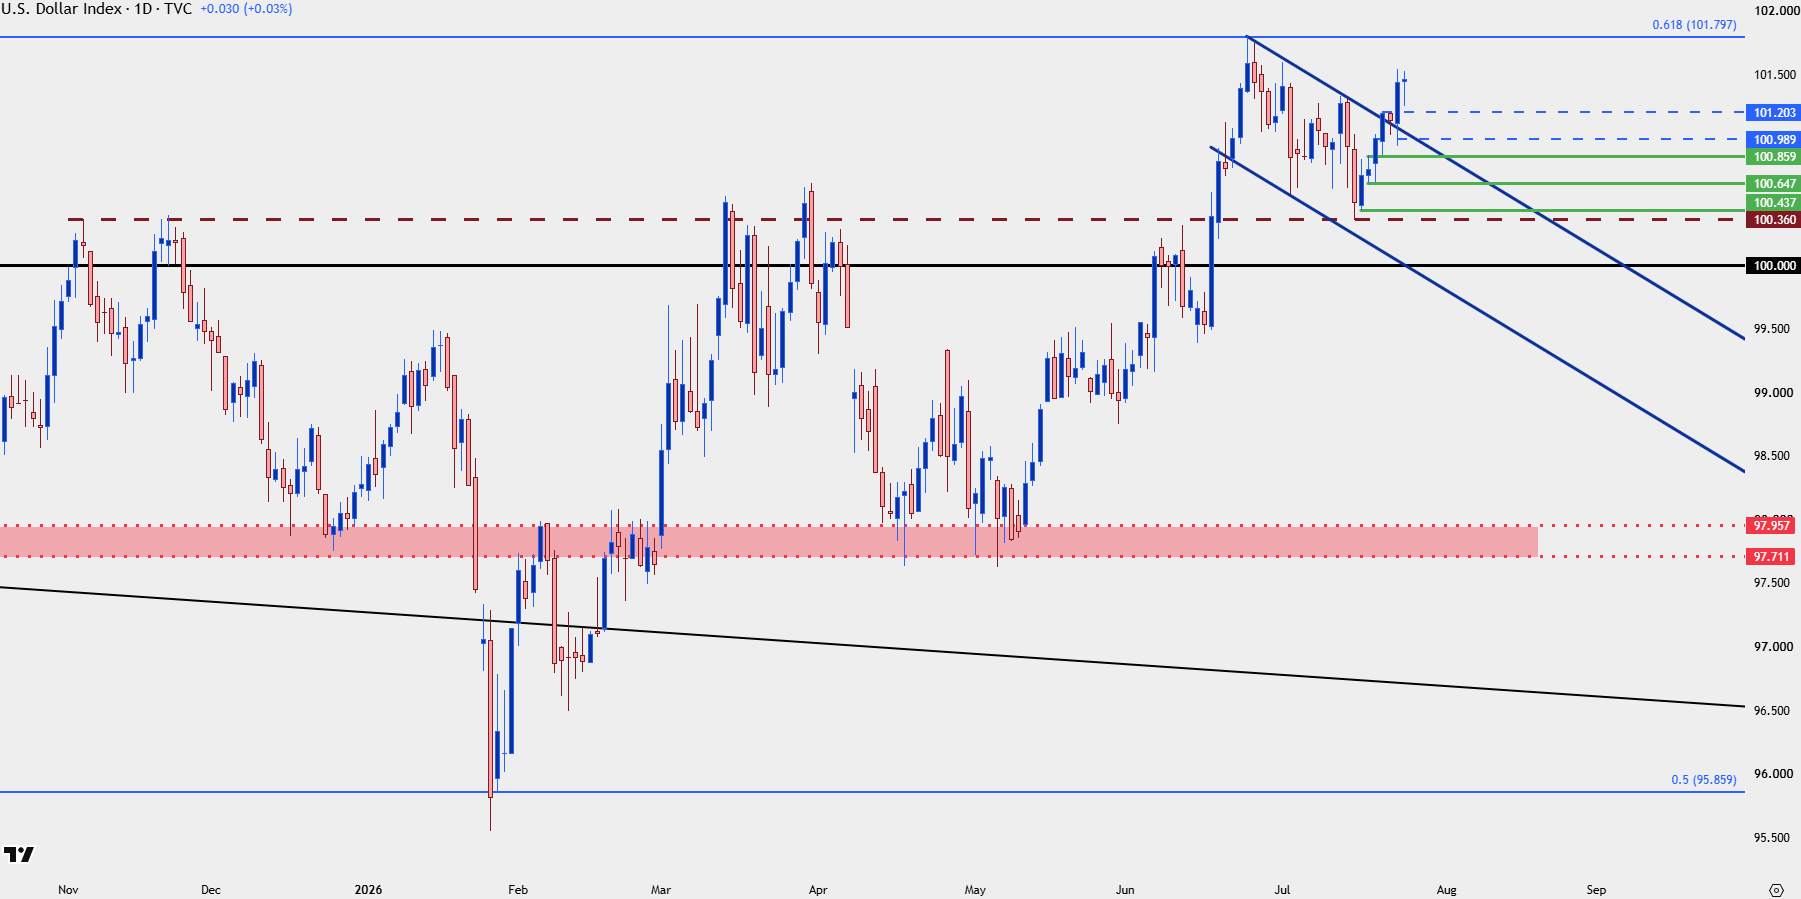
Chart prepared by James Stanley; data derived from Tradingview
USD Shorter-Term
Going into next week we have a bullish short-term trend to go along with that bullish bigger picture backdrop and there’s a few different spots to investigate for possible higher-low support in the Dollar. Nearby is the 101.20 and 101 areas, with 100.90, 100.65 and 100.36-100.44 areas.
Of course, as usual, the big question draws down to USD counterparts as the DXY basket is simply a composition of underlying currencies, so for strength themes to continue to play, we’ll likely need to see continued weakness in markets like the Euro or Japanese Yen.
US Dollar Four-Hour Price Chart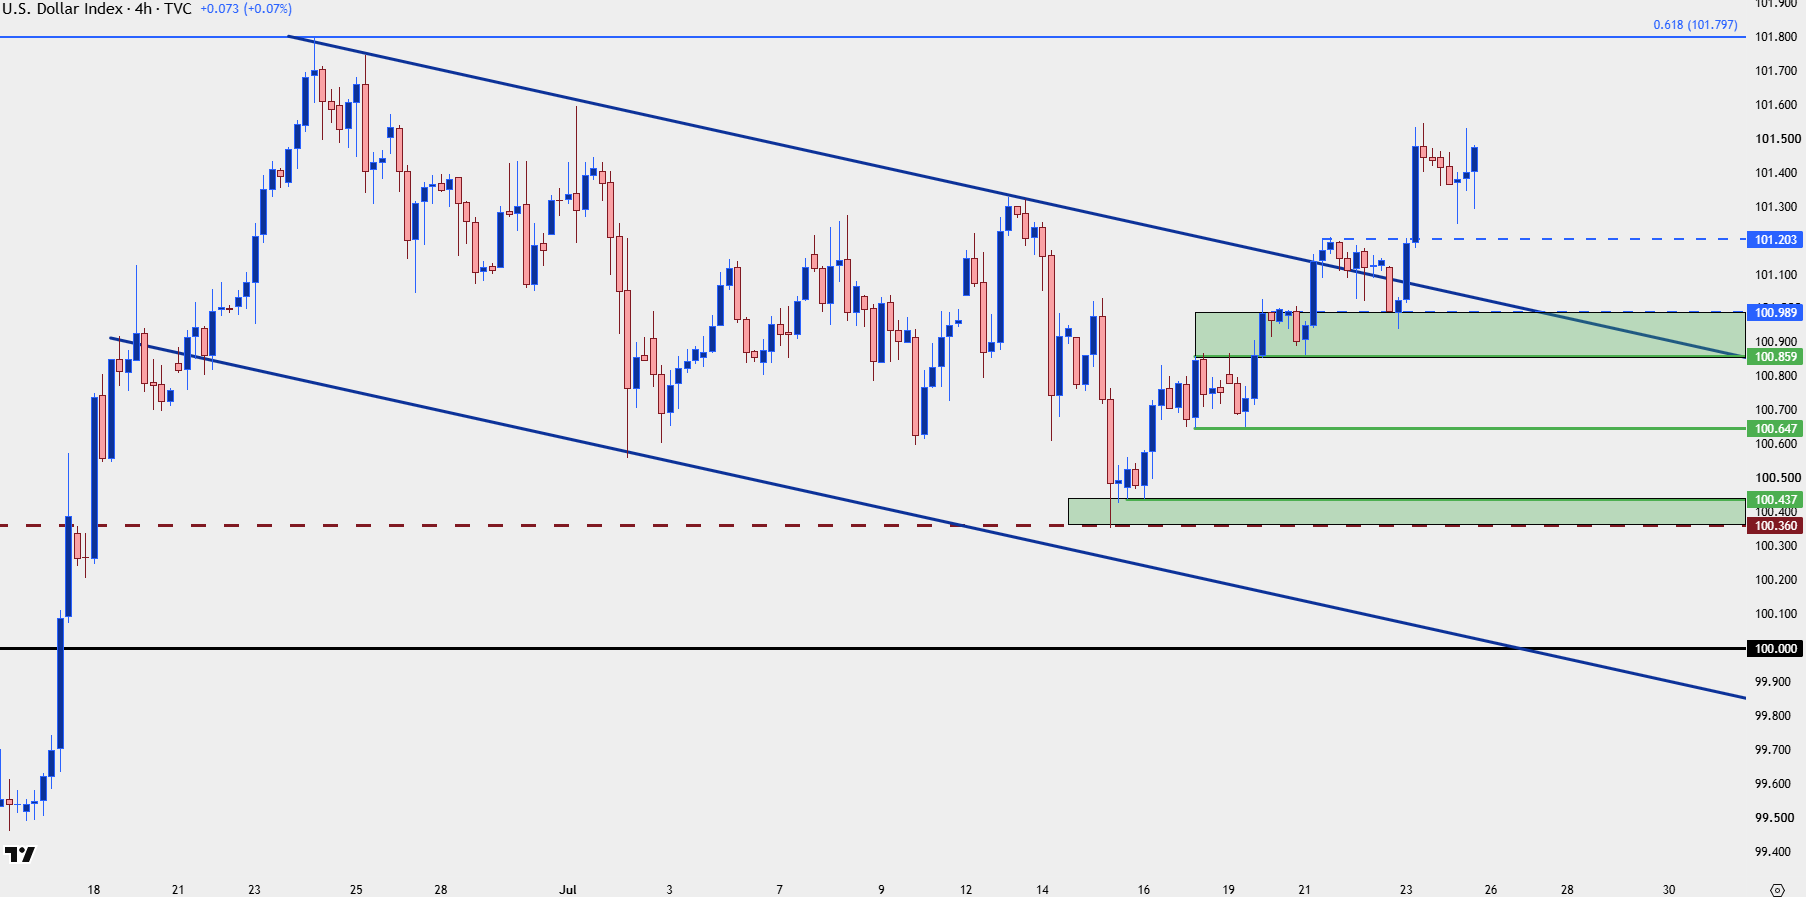
Chart prepared by James Stanley; data derived from Tradingview
USD/JPY
As looked at earlier in the week the Bank of Japan is between a rock and a hard place. It’s difficult to pick between either defending the Yen or supporting growth, especially given the bigger picture for the Japanese economy with a dwindling population and the hangover of decades of deflation and disinflation.
This helps to explain why, to this point, there hasn’t been much more than band aids applied to the matter in the form of interventions which, essentially, have been long opportunities for bulls after the dust has settled.
As we go into next week the BoJ is not expected to hike but I’d be surprised if Ueda doesn’t try to address the matter in some form, as failing to do so could lead to an aggressive continuation of a slide that would force the MoF into action. And that would cost capital in the form of burning finite FX reserves to bid down a move that their own rate policy is encouraging, so more likely from here, at least in my opinion, is we hear Ueda try to sound tough on inflation without doing anything concrete.
The more attractive scenario is if it would be enough to bring a pullback without too much to reverse the trend. Of course, we have the Fed to get through before that so the way that USD markets respond there will have impact to how USD/JPY sets up into the BoJ.
From a technical basis, 162.95 was resistance as an ascending triangle built and it hasn’t yet come in as support, so this would be an ideal area to look for bullish defense. Below that, 161.81 is of note before 160.64 comes into play.
USD/JPY Daily Chart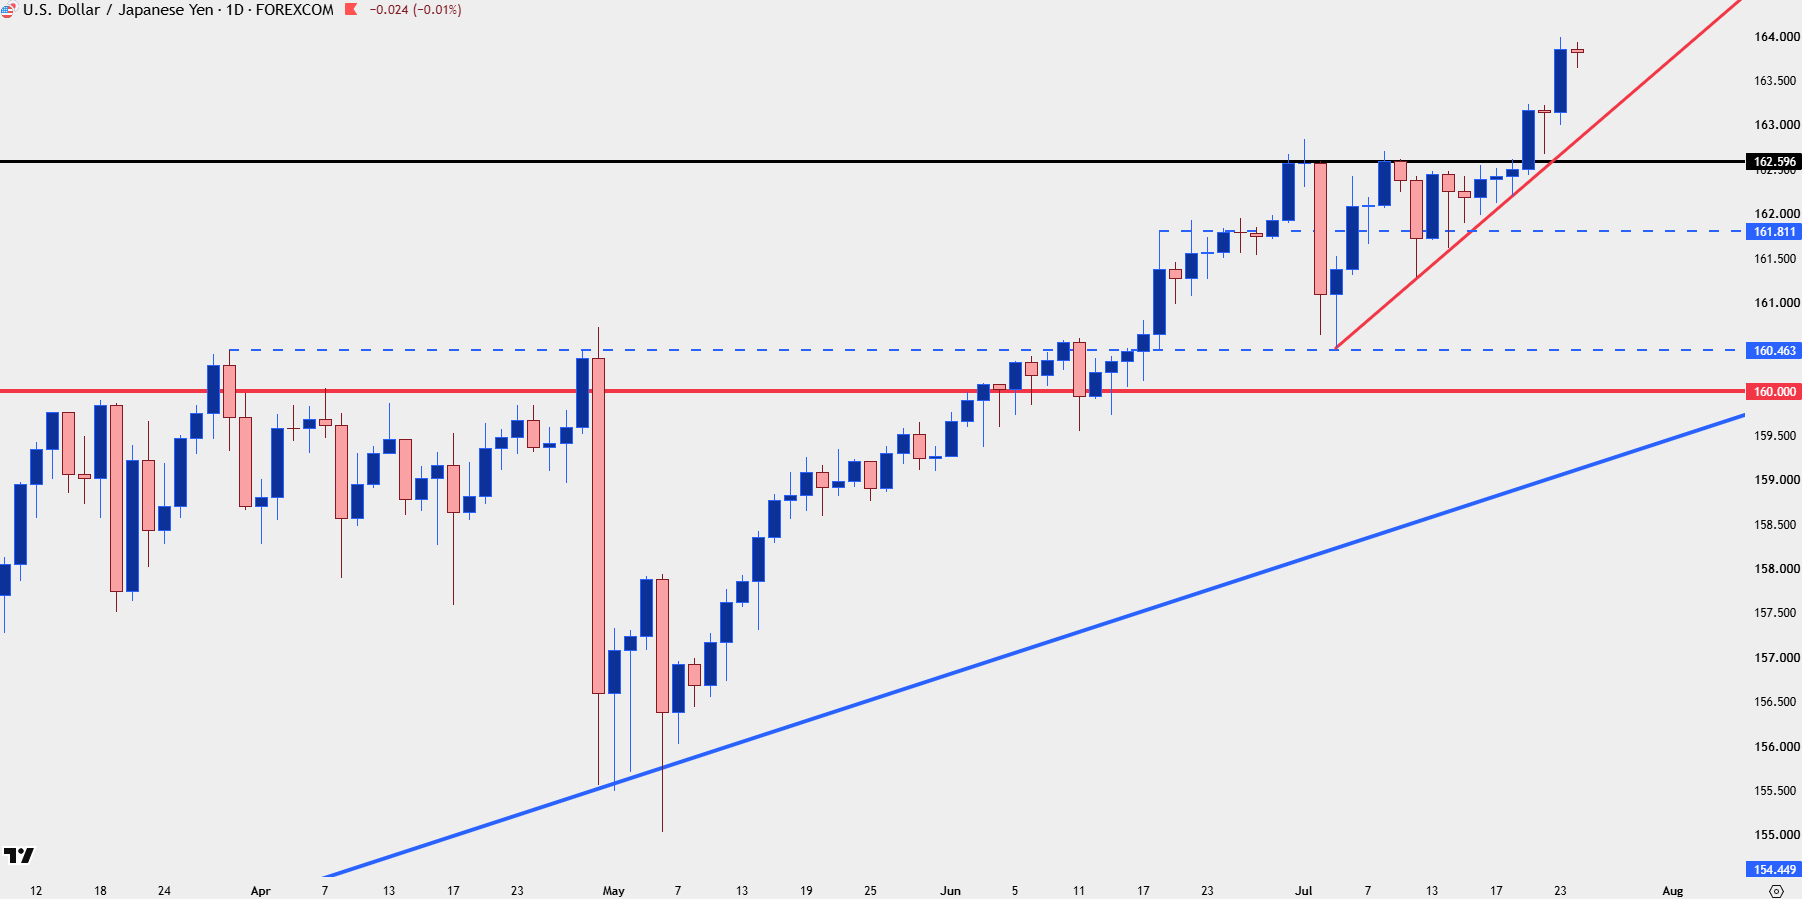
Chart prepared by James Stanley; data derived from Tradingview
EUR/USD
In the USD video on StoneX coming into this week, I shared my opinion that it was EUR/USD dynamics that would determine USD flows and that’s ended up as the case after the European Central Bank rate decision on Thursday.
That led to a bearish break of the bear flag in the EUR/USD pair which went along with the bullish break of the bull flag in the USD.
For next week, bears have an open door to make a move here as we have a bearish short-term setup and a bearish long-term setup, and that Thursday candle was both a bearish engulf as well as the downside break of the flag formation.
EUR/USD Daily Chart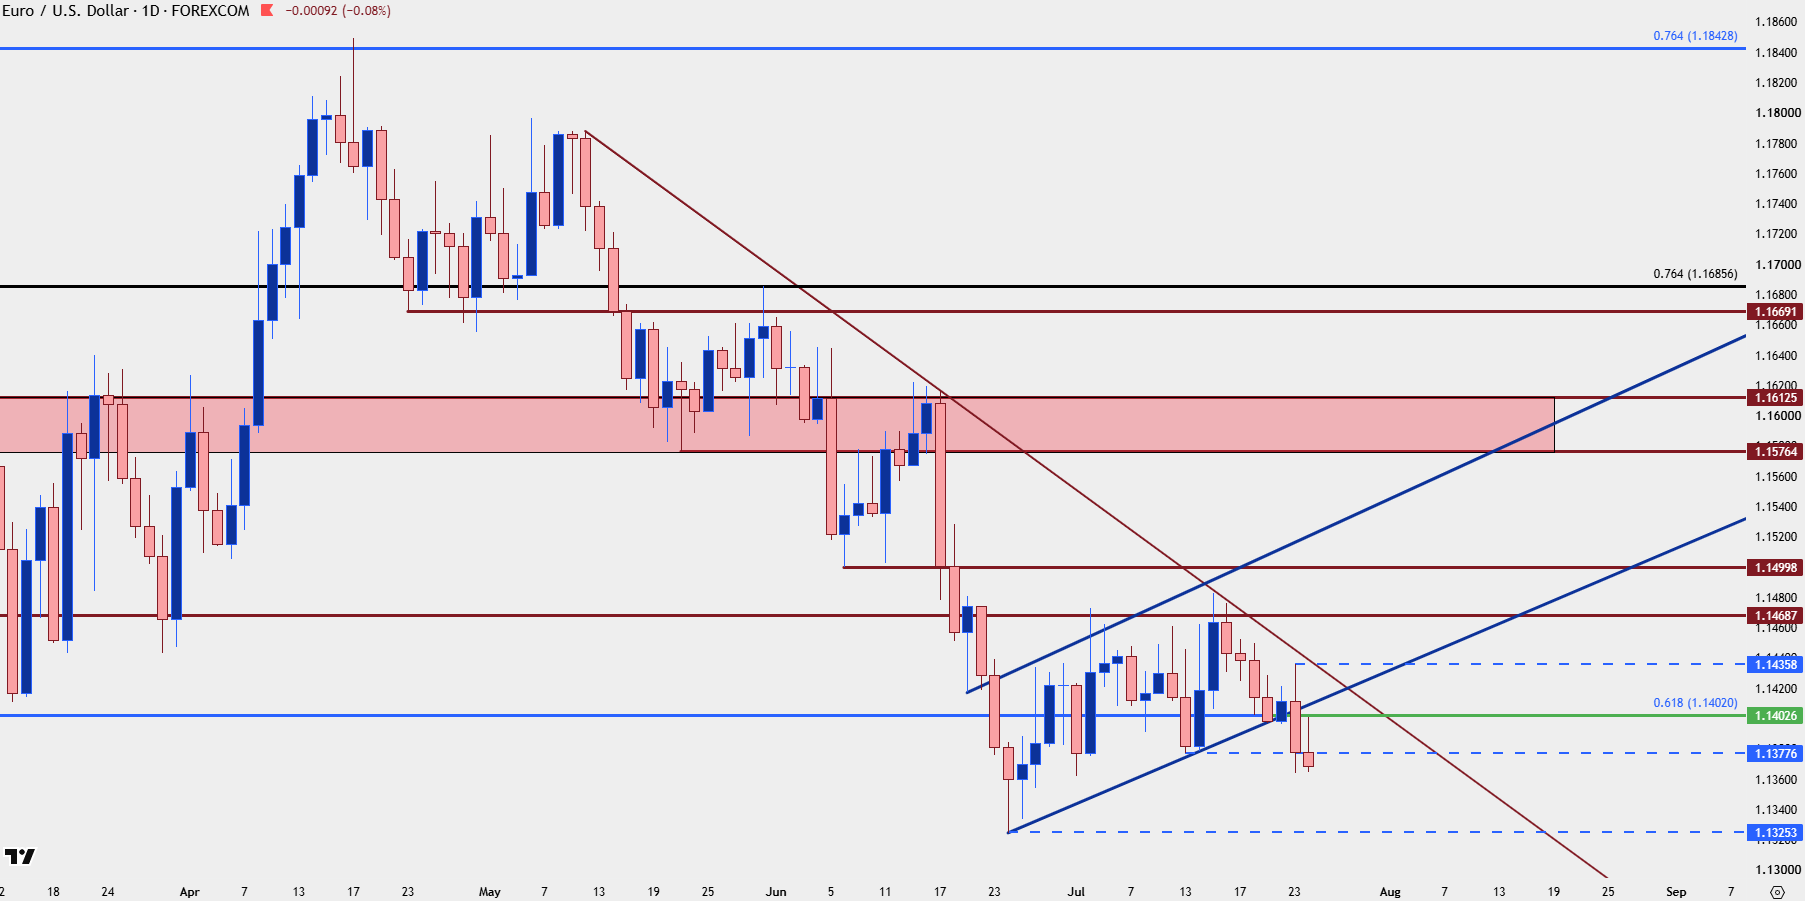
Chart prepared by James Stanley; data derived from Tradingview
GBP/USD
In the effort of balance, I often try to find something on the other side of the USD especially when there’s so many items pointing in a single direction. I’ve been tracking GBP/USD for USD-weakness setups and while that was attractive in early trade last week, as the pair broke out to a fresh higher-high on the US PPI report, the backdrop since has been unforgiving as USD strength has come roaring back.
For next week, there’s a BoE rate decision and that could be meaningful, particularly if Warsh sounds less hawkish than he did in June. Given the relative weakness in equities there may be reason for him to push in that direction and if that happens, I think GBP/USD could be one of the more attractive spots to look for Dollar weakness.
That said, price action on the four hour is bearish, so bulls have some work to do here if they’re going to turn this into a rally. There has been a bit of stalling around the 1.3300 but it’s 1.3390 that I would like to see come into play in order to set up that theme, after which higher-low potential could create a set up to work with.
GBP/USD Four-Hour Price Chart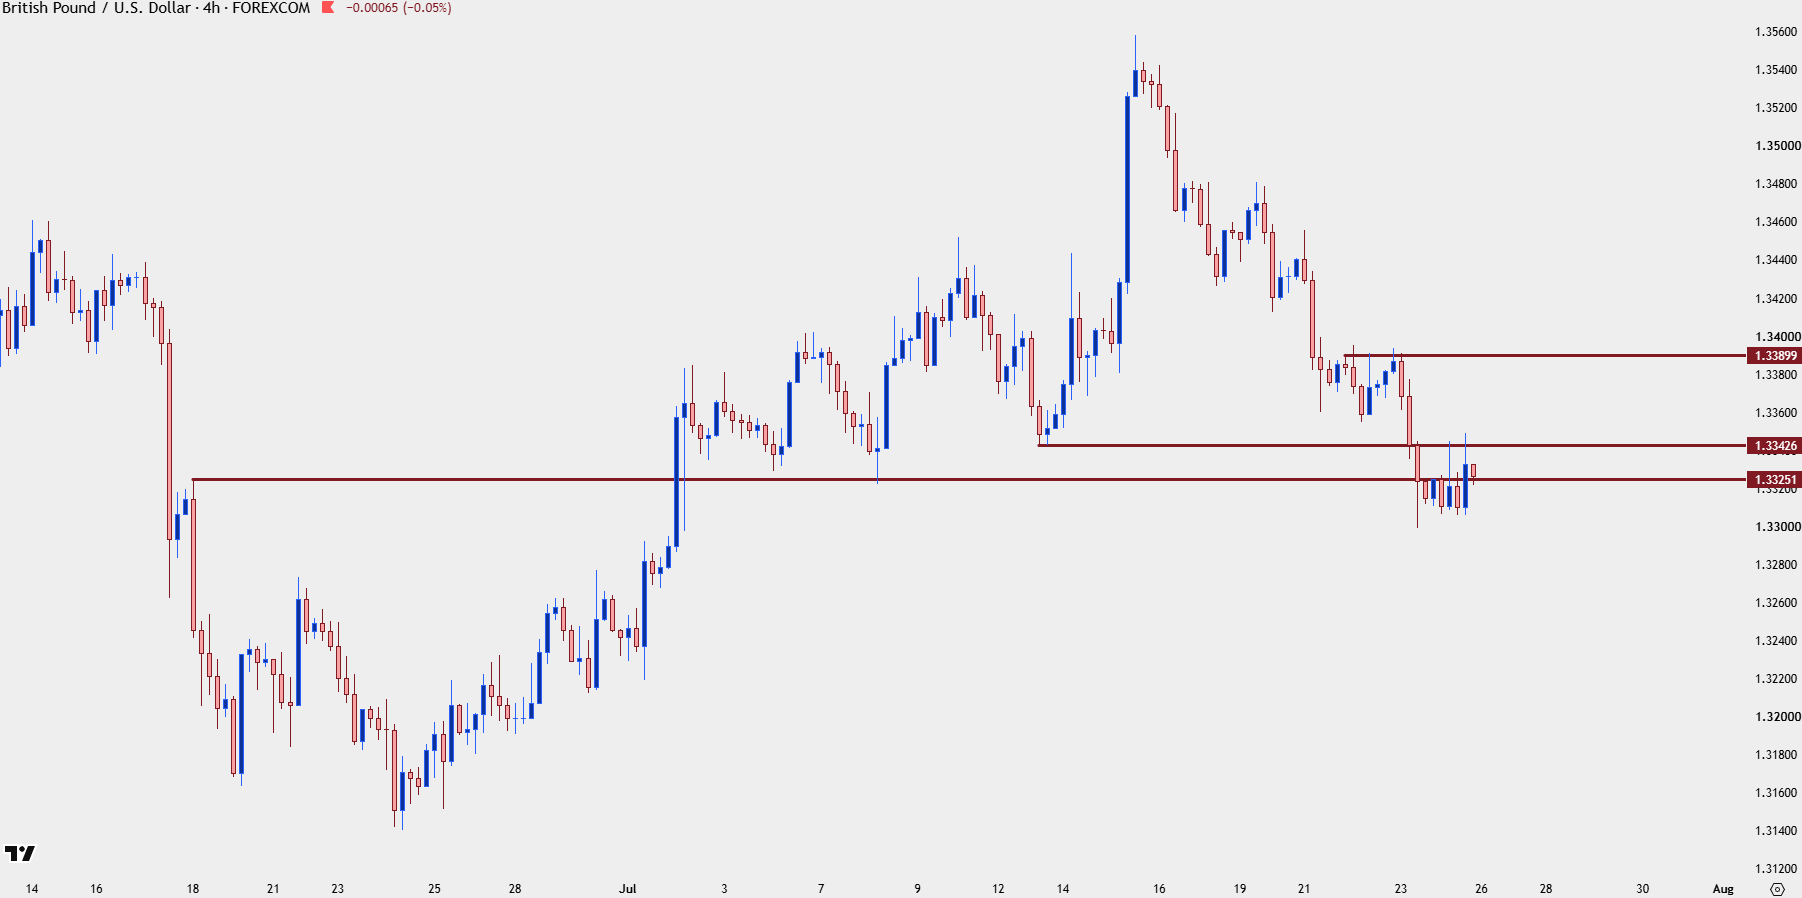
Chart prepared by James Stanley; data derived from Tradingview
--- written by James Stanley, Senior Market Analyst, Global Macro








Web Trader platform
Our sophisticated web-based platform is packed with features.
Open an account today
Experience award-winning platforms with fast and secure execution.
Economic calendar
Related articles

Canadian Dollar Forecast: USD/CAD Weekly Reversal Puts Yearly Uptrend Back in Focus 8 29 2026
USD/CAD has staged its strongest weekly advance since June, shifting the focus to whether a more durable low is finally taking shape.


USD/JPY weekly outlook: Payrolls may challenge the Fed’s hawkish reset
USD/JPY has finally woken from its slumber. Payrolls now loom as the key test of whether the latest hawkish repricing sticks or sinks.


Euro Short-term Outlook: EUR/USD Pullback Nears Pivotal Uptrend Support 8 28 2026
Warsh's comments accelerated the EUR/USD selloff, raising the stakes as buyers look to stabilize the broader recovery.