


US Dollar (DXY), USD/JPY Forecast: Key Levels to Watch
US Dollar (DXY) and USD/JPY Forecast: Key levels to watch amid yen intervention risks, geopolitical developments, and shifting monetary policy expectations.
Written by
Razan Hilal
Market Analyst
After a steep rally this year, the US Dollar Index (DXY) and USD/JPY quickly dropped on profit-taking and yen intervention, taking the market spotlight amid persistent geopolitical risks and Fed rate hike worries.
The steep sell-offs from yearly highs— nearly 200 points for the DXY and 900 points for USD/JPY—aligned with the up trending support levels defining the bullish bias throughout the year for both charts, marking a critical point between:

- A bullish continuation in the dollar amid persistent geopolitical risks.
- US-Iran negotiations over the reopening of the Strait of Hormuz (markets need a lasting agreement).
- Fed rate hike expectations for a 25 bps rate hike in September by 25 bps.
- US economic data, with NFP due on Friday.
- Further yen intervention risks, noting that the market may have fully priced in such rhetoric, with rate differentials between the Fed and the BOJ remaining a key barrier to sustainable yen strength unless the BOJ adopts a rate-hiking path.
Key levels stand to define whether the dollar's time has come to shift toward a long-term bearish bias or whether its multi-year bull run remains intact.
US Dollar (DXY) Outlook: Daily Time Frame – Log Scale
Source: Trading view
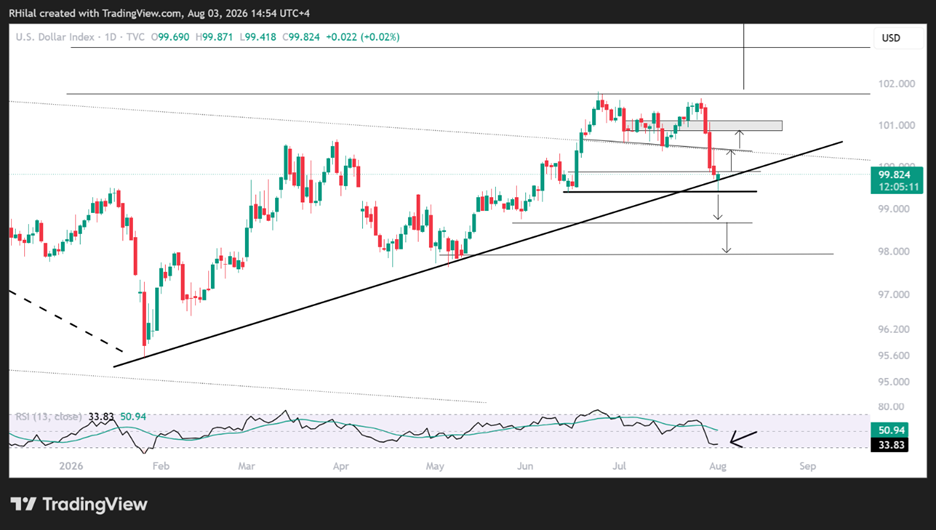
The recent pullback in the DXY occurred just below the critical 101.80–102.00 resistance zone, which remains the key area to confirm another bullish breakout.
Despite the decline, price action continues to respect:
- The ascending trendline connecting the higher lows established throughout 2026, reinforcing the broader bullish structure.
- The 99.30 mark, representing the 38.2% Fibonacci retracement of the 2026 advance.
- Oversold daily momentum conditions last seen in January 2026.
As long as the index remains above the 99.30–100.30 support zone, the 2026 bullish outlook remains intact. A breakdown below 99.30 could shift the narrative, increasing bearish pressure toward the 98.60–98.00 region, which marks the 61.8% Fibonacci retracement.
The daily chart therefore continues to suggest that the recent weakness represents a correction within the prevailing uptrend rather than the beginning of a broader reversal, similar to the monthly chart's outlook.
US Dollar (DXY) Forecast: Monthly Time Frame – Log Scale
Source: Trading view
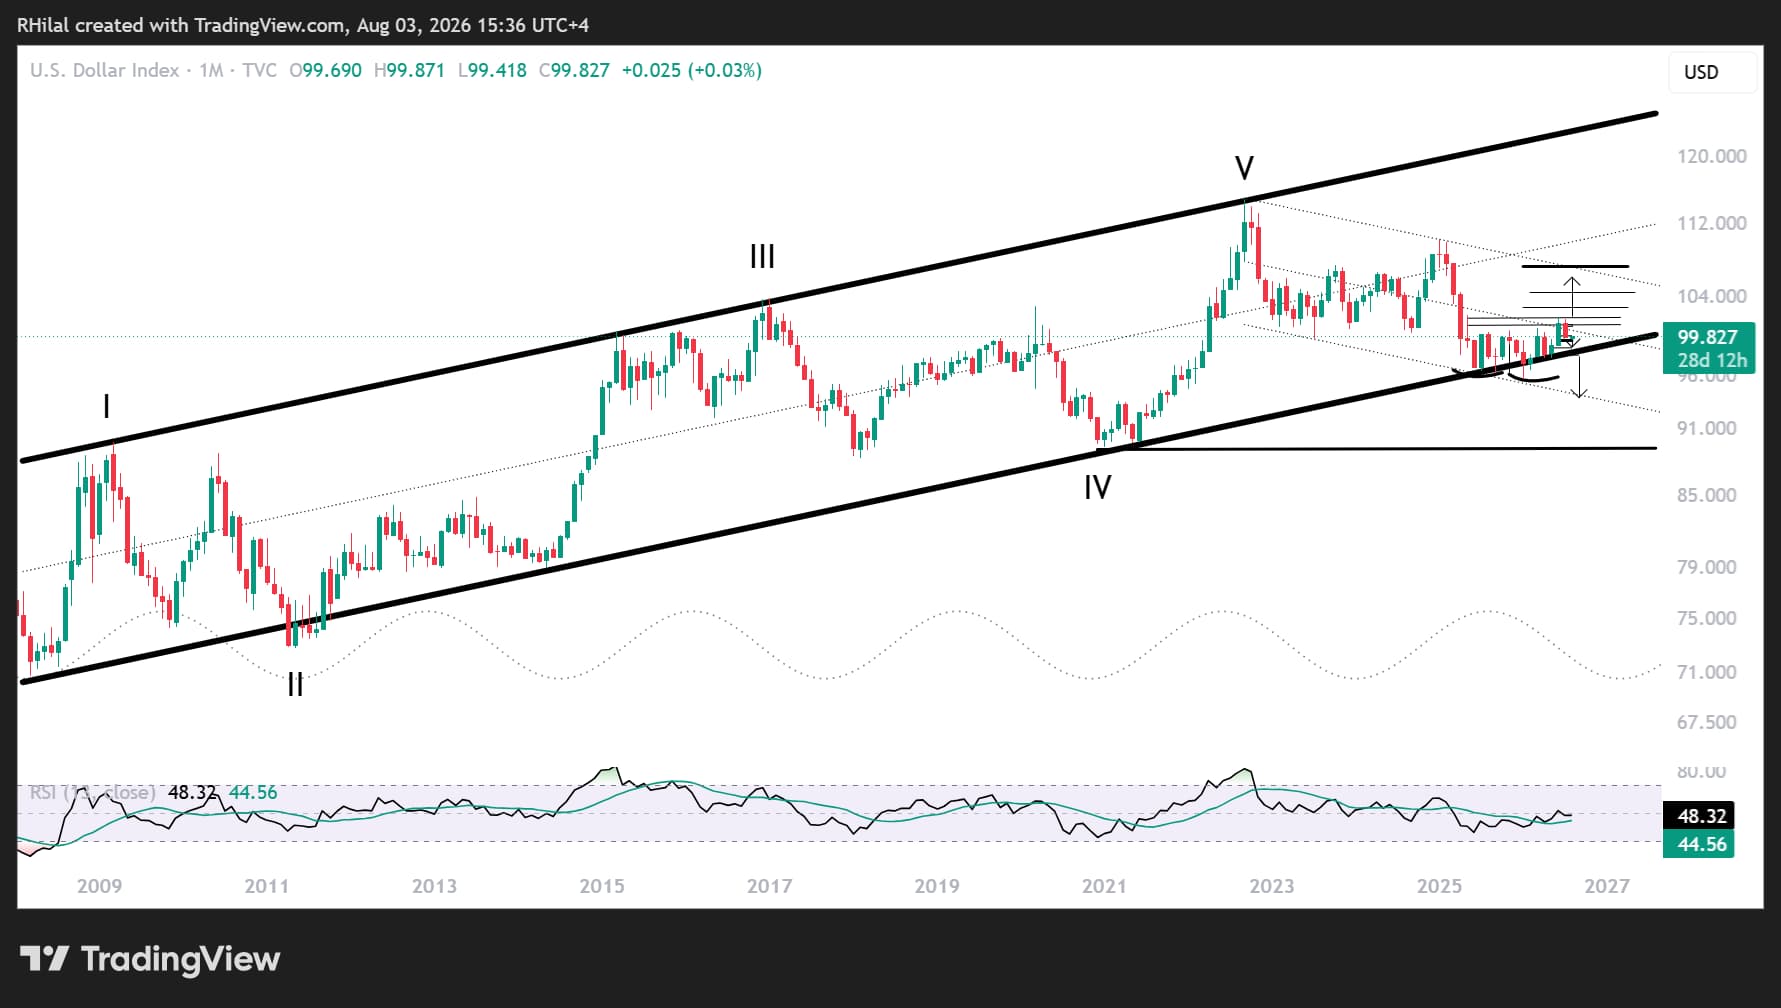
The monthly chart continues to reinforce the US Dollar Index's broader bullish structure through several important technical developments:
- An ascending channel dating back to 2008 continues to support the Dollar Index's long-term uptrend. Its lower boundary, near the 95–97 zone, remains the next major support area should the DXY close below 99.30, invalidating the 2026 bullish structure. Such a move could either trigger another long-term rebound or mark the beginning of a broader structural drawdown.
- The DXY is currently in pullback mode after testing a major technical confluence that includes:
- The neckline of a potential double-bottom pattern, positioned between the long-term 2008 ascending channel and the 2022–2026 descending channel.
- The midpoint of the 2022–2026 descending channel.
- A multi-year support and resistance zone that has repeatedly defined price action since 2023.
A monthly close above 102.00 would strengthen the bullish outlook, exposing the next resistance levels at 102.80, 104.50, and ultimately 107.00, which coincides with the upper boundary of the descending channel in place since 2022.
Such a move would likely coincide with renewed geopolitical tensions, stronger inflationary pressures, or a more hawkish Federal Reserve. It would also increase downside pressure across major currencies and precious metals, potentially pushing them toward fresh yearly lows before a longer-term reversal emerges.
As long as Middle East tensions persist, crude oil prices remain supported above the $70–80 per barrel region, and dollar pairs continue to hold above their year-long bullish structures, upside risks for the dollar are likely to remain elevated.
USDJPY Forecast: Weekly Time Frame – Log Scale
Source: Trading view
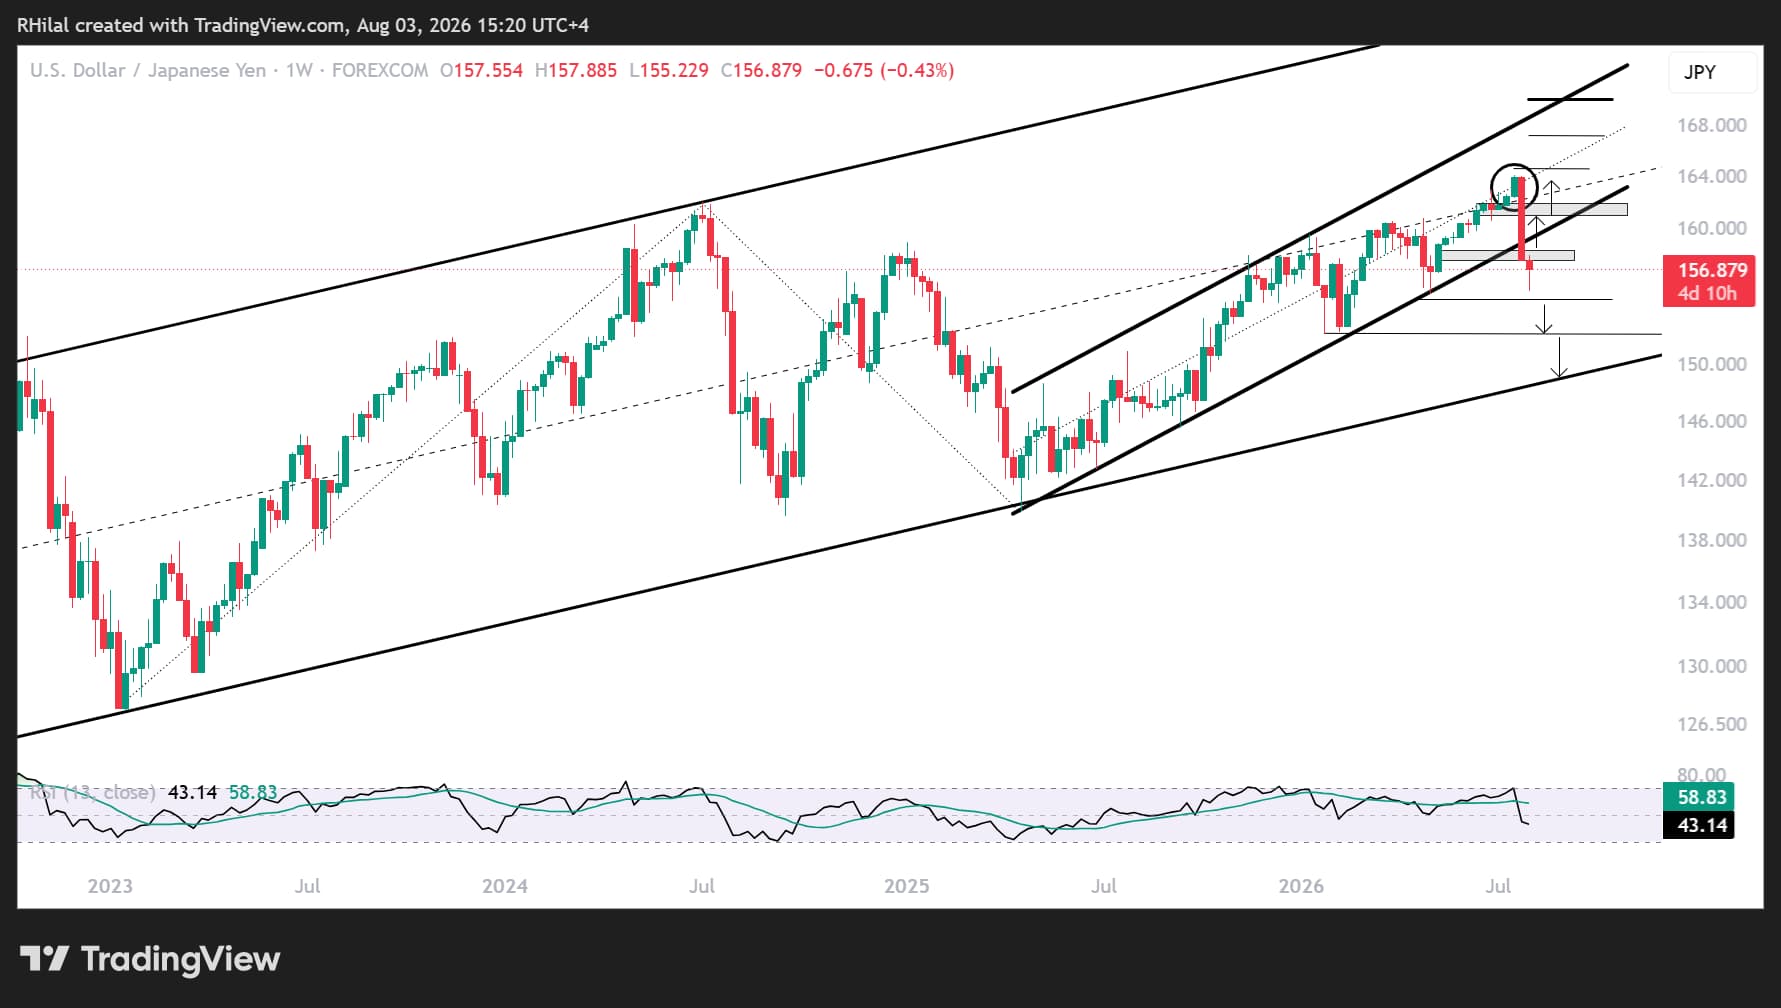
The USD/JPY sell-off from the 164 confluence zone, a resistance area aligned with the midpoint of the April 2025–July 2026 channel and the 2022–2026 channel, last found support near the 155 mark.
Current support aligns with:
- The 38.2% Fibonacci retracement of the April 2025–July 2026 advance.
- Bearish weekly momentum consistent with 2025 levels.
- Oversold daily momentum last seen in 2024.
- A possible breakdown below the 2025–2026 channel.
Should this drawdown stabilize above the 155 mark, bullish momentum may return to the 2025–2026 channel and extend the move toward 157.50, 161.00, 161.80, and eventually 164.00. These previous support levels may turn into resistance during another major test of a zone last seen in the 1980s, where a close above 164 would open the path toward the channel's upper boundary near 170, following that significant momentum recharge.
If not, a close below 155 exposes the next key support levels near 152 and 149, a critical area aligning with the lower boundary of the 2022–2026 channel and defining the barrier between a long-term bullish or bearish bias for the dollar, not just against the yen but across broader markets.
Expectations continue to favor a bullish bias unless a lasting framework for the governance of Middle East straits is established, Treasury yields decline, and the Fed rate hike narrative fades.
Written by Razan Hilal, CMT
Follow on X: @Rh_waves
Related tags:







Web Trader platform
Our sophisticated web-based platform is packed with features.
Open an account today
Experience award-winning platforms with fast and secure execution.
Economic calendar
Related articles

USD/JPY weekly outlook: Payrolls may challenge the Fed’s hawkish reset
USD/JPY has finally woken from its slumber. Payrolls now loom as the key test of whether the latest hawkish repricing sticks or sinks.

Euro Short-term Outlook: EUR/USD Pullback Nears Pivotal Uptrend Support 8 28 2026
Warsh's comments accelerated the EUR/USD selloff, raising the stakes as buyers look to stabilize the broader recovery.


EUR/USD forecast: All eyes on Warsh at Jackson Hole - Forex Friday
For much of this week, the EUR/USD has been edging lower with the US dollar regaining some ground after last week’s sell-off that was triggered, in part, by the bond market worries. Investors have been unwilling to bet further against the US dollar so far this week ahead of Kevin Warsh’s keynote speech at the Jackson Hole summit, due later today.
