

USD Follows Path of Least Resistance into Jackson Hole
The Jackson Hole Economic Symposium has brought some large shockwaves to markets over the past 15 years but this is the first for new FOMC Chair Kevin Warsh.
Written by
James Stanley
Sr. Strategist
US Dollar Talking Points:
- Short-term price action in DXY has continued to crawl higher, with a higher-low support hold leading into a bounce.
- Longer-term, this looks corrective in nature and that seems to fit with the bigger picture as USD/JPY remains crowded with bulls so far unable to prod a break above 160.00, and for bigger picture themes of USD-strength the USD/JPY pair would likely need to show greater continuation potential.
As we go into the Jackson Hole Economic Symposium hopes are high that Kevin Warsh will break his recent stride by giving some degree of forward guidance on economic performance. At his first meeting in June, markets got a bit of shock which showed in some important ways, with USD-strength and a bit of weakness in stocks. That ultimately helped to drive the $4k test in spot Gold and rates markets got into a peculiar spot – expecting the Fed to lean hawkish to the point that the July rate decision was a veritable coin flip just ahead of the meeting.
Of course, at that July meeting there was no hike, and Warsh remained evasive although he continued to reiterate that the bank’s primary focus is to fight inflation which hasn’t been below target on an annualized basis, whether that’s CPI or PCE, since before the ‘supply chain,’ ‘transitory’ inflation of 2021 and 2022.
The net response was largely an unwinding of those prior moves as equity strength quickly came back and gold prices broke out in a very big way a week later, and that was followed by the Bitcoin breakout last week.
At this point I think it’s a stretch to look for Warsh to be overly descriptive at his Jackson Hole speech, particularly with stock showing a degree of relative strength after the NVDIA earnings announcement yesterday. With Core PCE coming in at the expected 3.3%, there’s still no call for victory laps yet with mid-terms just two months away, there’s probably little motivation to frighten markets and crater equities.
With roughly 72% probability of a rate hike by the end of this year, there’s a lot of room for those expectations to shift should Warsh echo a similarly evasive tone, but perhaps more important across FX markets is whether something else happens regarding the USD/JPY pair as that market continues to cast a massive sway over the larger USD complex.
In DXY, it’s largely the same as I had looked at in the Tuesday webinar. There’s short-term strength with higher-highs and lows, and prices have pushed into a key resistance zone (as taken from prior support).
US Dollar Four-Hour Chart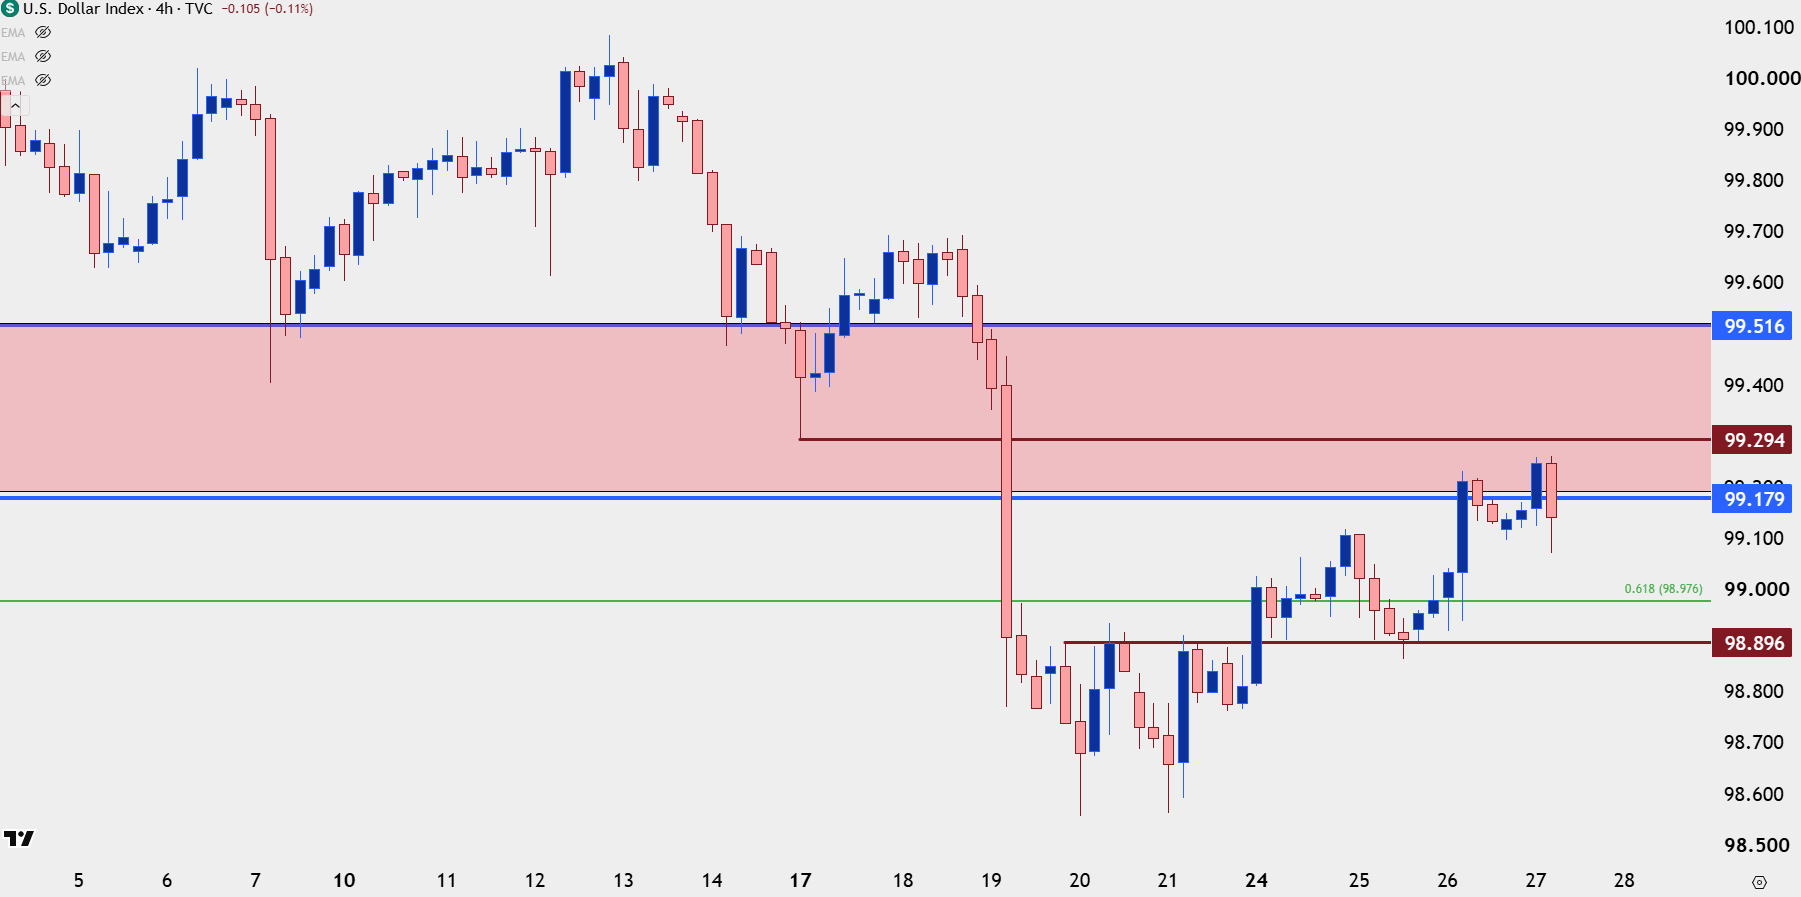
Chart prepared by James Stanley; data derived from Tradingview
USD Daily
From the daily and longer, however, this sequencing of strength over the past week looks like a pullback in a broader bearish trend. And I think that aligns well with the bigger picture, as a bigger move of USD-strength will likely need at least some push from the USD/JPY pair, and this would seem an upstream battle given the dual intervention from both the US and Japan. And with a major macroeconomic event coming up in Jackson Hole, and Japanese officials concerned by their own rising yields, it would seem an opportune time to address the matter, in some way.
US Treasury Secretary Scott Bessent last week in a media interview alluded to knowing something that the market didn’t yet know regarding the Japanese Yen and the intervention. It remains to be seen if that was bluster and a threat, an attempt at jawboning longs out of the trade for fear of what might happen, or whether there will be some type of new announcement on the matter in the coming days. Circulating rumors of a September rate hike from the BoJ did little to the USD/JPY trend and longer-term yields continue to move up.
On the daily DXY chart there’s a few spots of resistance, the first of which is already in-play at 99.18/99.30. Above that, 99.52 is the top-side of a zone that was holding support before the breakdown last week.
US Dollar Daily Price Chart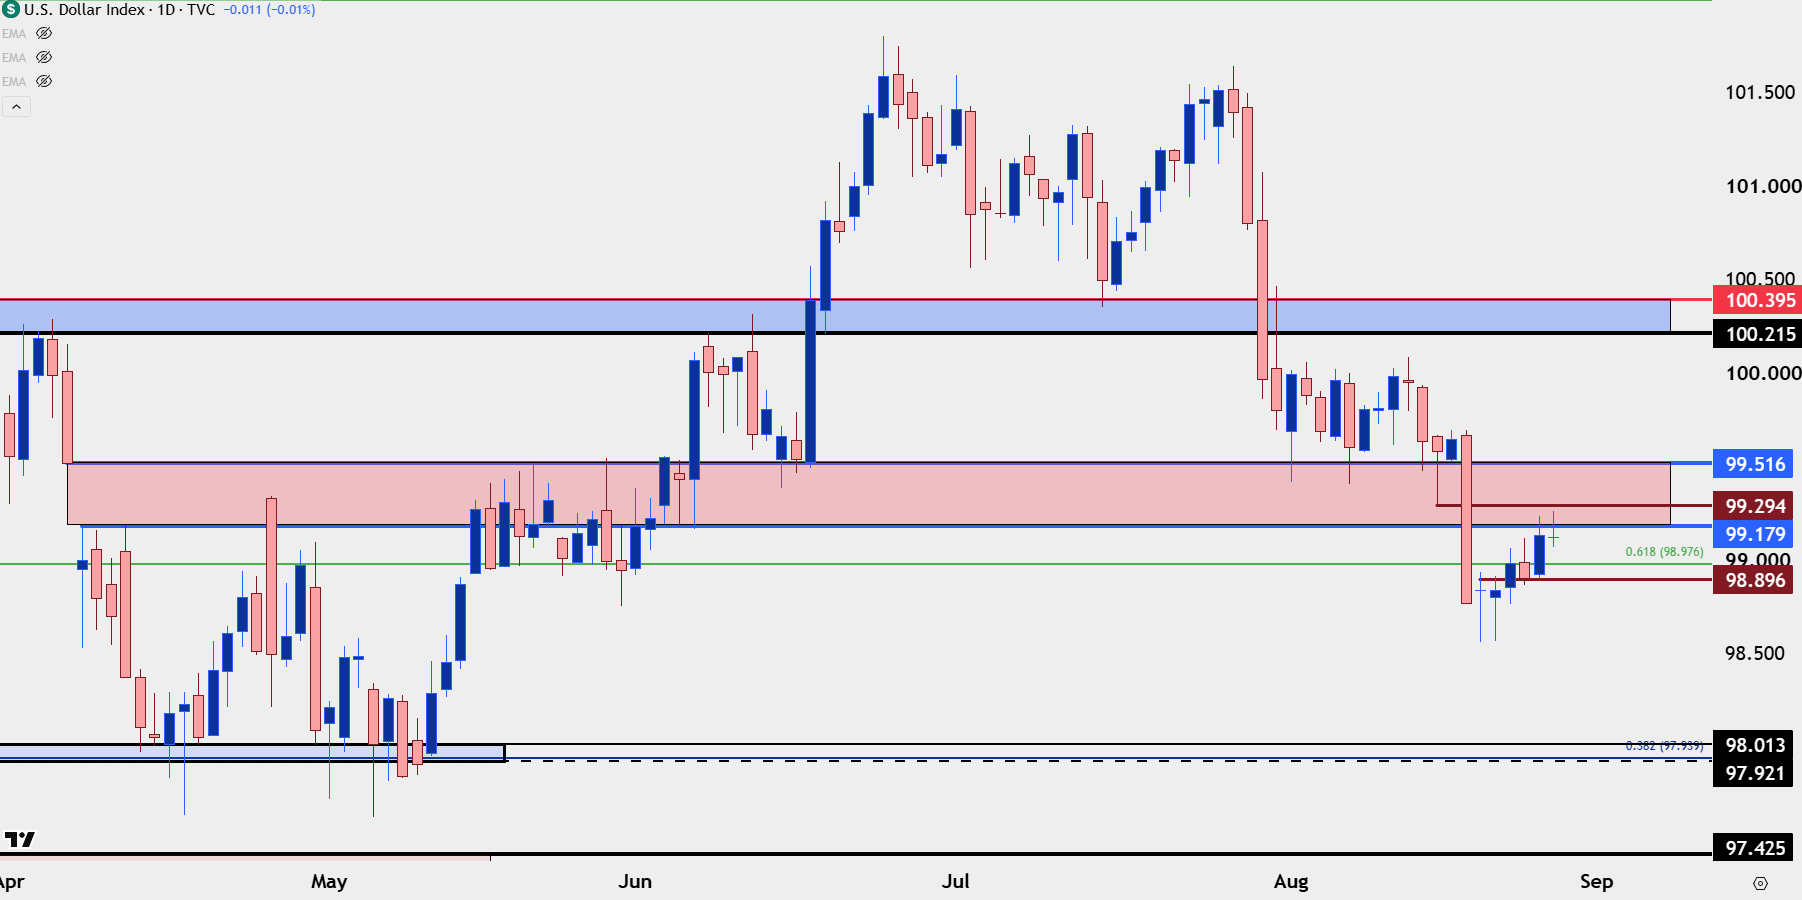
Chart prepared by James Stanley; data derived from Tradingview
--- written by James Stanley, Senior Market Analyst, Global Macro
Related tags:







Web Trader platform
Our sophisticated web-based platform is packed with features.
Open an account today
Experience award-winning platforms with fast and secure execution.
Economic calendar
Related articles

Nasdaq 100 Forecast: NDX slips ahead of Fed Chair Warsh’s speech
U.S. stocks are edging lower on Friday, giving back some of yesterday's gains after Nvidia's strong outlook revived the tech trade. The focus has now shifted firmly to Fed Chair Kevin Warsh's Jackson Hole speech, with investors looking for more clarity on the outlook for interest rates.


S&P 500 Forecast: SPX after Nvidia revives confidence in the AI trade
U.S. stocks are heading higher on Thursday, with technology leading the move after Nvidia's stronger-than-expected outlook revived confidence in the AI trade.

Dow Jones Forecast: DJIA rises, tech rebounds
U.S. stocks are heading higher on Tuesday as Treasury yields fall and semiconductor stocks recover. Investors are positioning ahead of Nvidia's earnings tomorrow and the Federal Reserve's Jackson Hole symposium later this week.