

USD/JPY Threatens Breakout on Bull Pennant Resistance Test
Japanese Yen weakness remains one of the clearest themes across the FX market and GBP/JPY has already hit fresh 18-year highs. USD/JPY is now set up to test its own breakout with the possibility of stops above highs triggering a short squeeze scenario.
Written by
James Stanley
Sr. Strategist
JPY, USD/JPY Talking Points:
- I looked into this on Monday and it was my first article in more than two months, looking at what I thought to be one of the more important and impactful macro themes across markets.
- While many retail traders think intervention is a simple task and the exchange rate of one of the world’s largest markets is easily manipulated, the reality is that USD/JPY is a free market and any meddling from policymakers comes with possibility of consequences.
USD/JPY is on the verge of testing a breakout and I think this is an important time to revisit the manner, as I’ve seen multiple retail traders pointing to 163 as a point of possible resistance with the hope that the Japanese government might take effort to defend the level. This seems very similar to the episode we had back in 2022 at 150, or 2024 with 151.95 and then 160. We saw this pop up again earlier this year, as USD/JPY was testing for another break of the 160 level, which eventually took place in both March and April followed by a prolonged breakout in June that remains in-place today.
At this point the USD/JPY pair holds a bull pennant formation and buyers have exhibited strong control of the trend. As written on Monday, the CPI-fueled pullback was but an opportunity for buyers to load up at lower prices, and this is at least partly why the pair is on verge of breakout now despite below-expected prints from both CPI and PPI.
This is the trend talking, as prices have continued to rally even in light of what would normally be expected as bearish drivers.
USD/JPY Daily Price Chart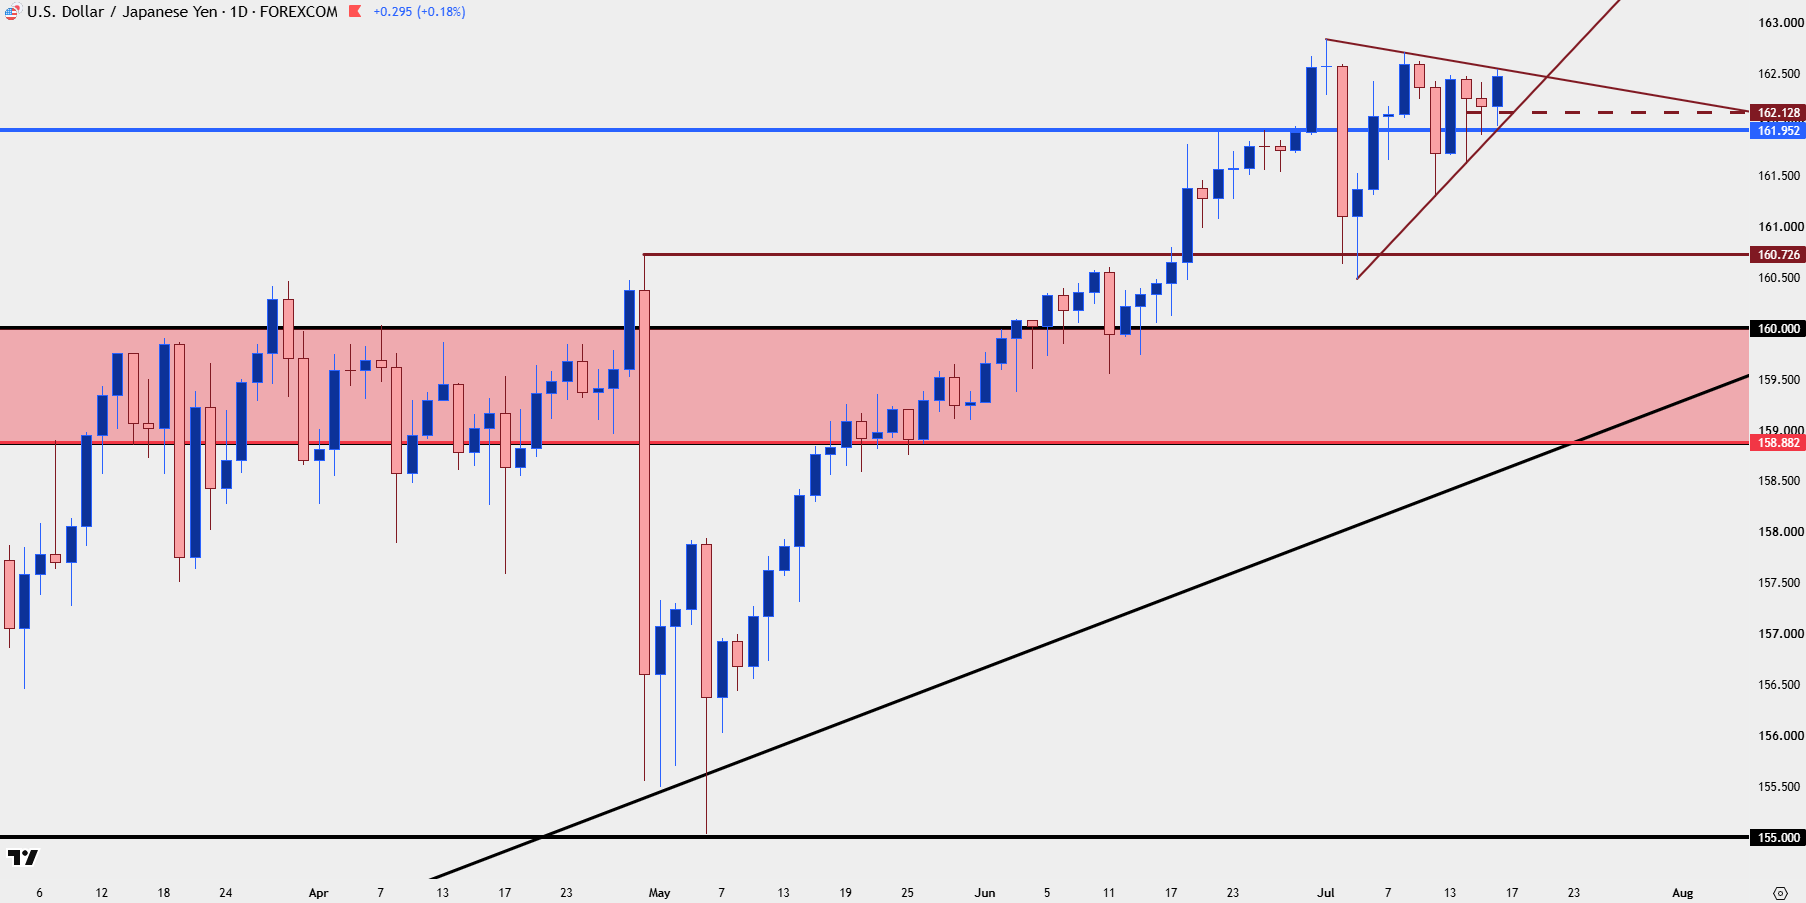
Chart prepared by James Stanley; data derived from Tradingview
The Reality of Intervention
It’s often the loudest traders that are the least experienced. Being through more and more of these scenarios highlights just how much we don’t or can’t know about what’s going to happen. So in a way it’s almost as if humility must be earned to be learned and that then pushes the traders focus to survival when encountering the unknown, rather than pure unbridled greed.
While threats of intervention, or even interventions themselves can produce counter-trend moves, the reality is that fundamental forces remain important and impactful. But it’s not as simple as looking at central bank rates to say that US rates are higher and Japanese rates are lower so the price should move in a linear manner. No, there’s more nuance than that, and this is where the role of expectations come into play. And when we have a backdrop where the US may be going into a phase where rate cuts could come into play, or maybe even a phase were slower rate hikes might be in the picture, that could precipitate a sell-off.
This explains what showed in Q4 of 2022 and while an intervention at 151.95 is often credited with stopping the rally in the pair, that move really just stalled the breakout. It was a below-expected CPI print in November of that year that finally allowed for the breakdown. And despite the still-favorable rate advantage to the US, the USD/JPY trade had become crowded and the prospect of change allowed for a strong reversal that lasted over the next couple of months.
But by mid-January the longs that wanted to close had already done so, and the fundamental disparity again came back into the picture.
Since then, the US has been through two phases of rate cuts and now with inflation remaining high and incoming Fed Chair Kevin Warsh sounding more hawkish than what many expected a Trump appointee to sound, USD-strength has been back in the picture over the past couple of months, and that’s helped to drive a fresh forty year high in the USD/JPY pair.
As looked at on Monday, this puts emphasis on the next logical round price higher, which is the 165 level that was last in-play back in 1986. So far – there’s been a degree of stalling inside of that level, with 163.00 currently showing as near-term resistance.
USD/JPY Four-Hour Chart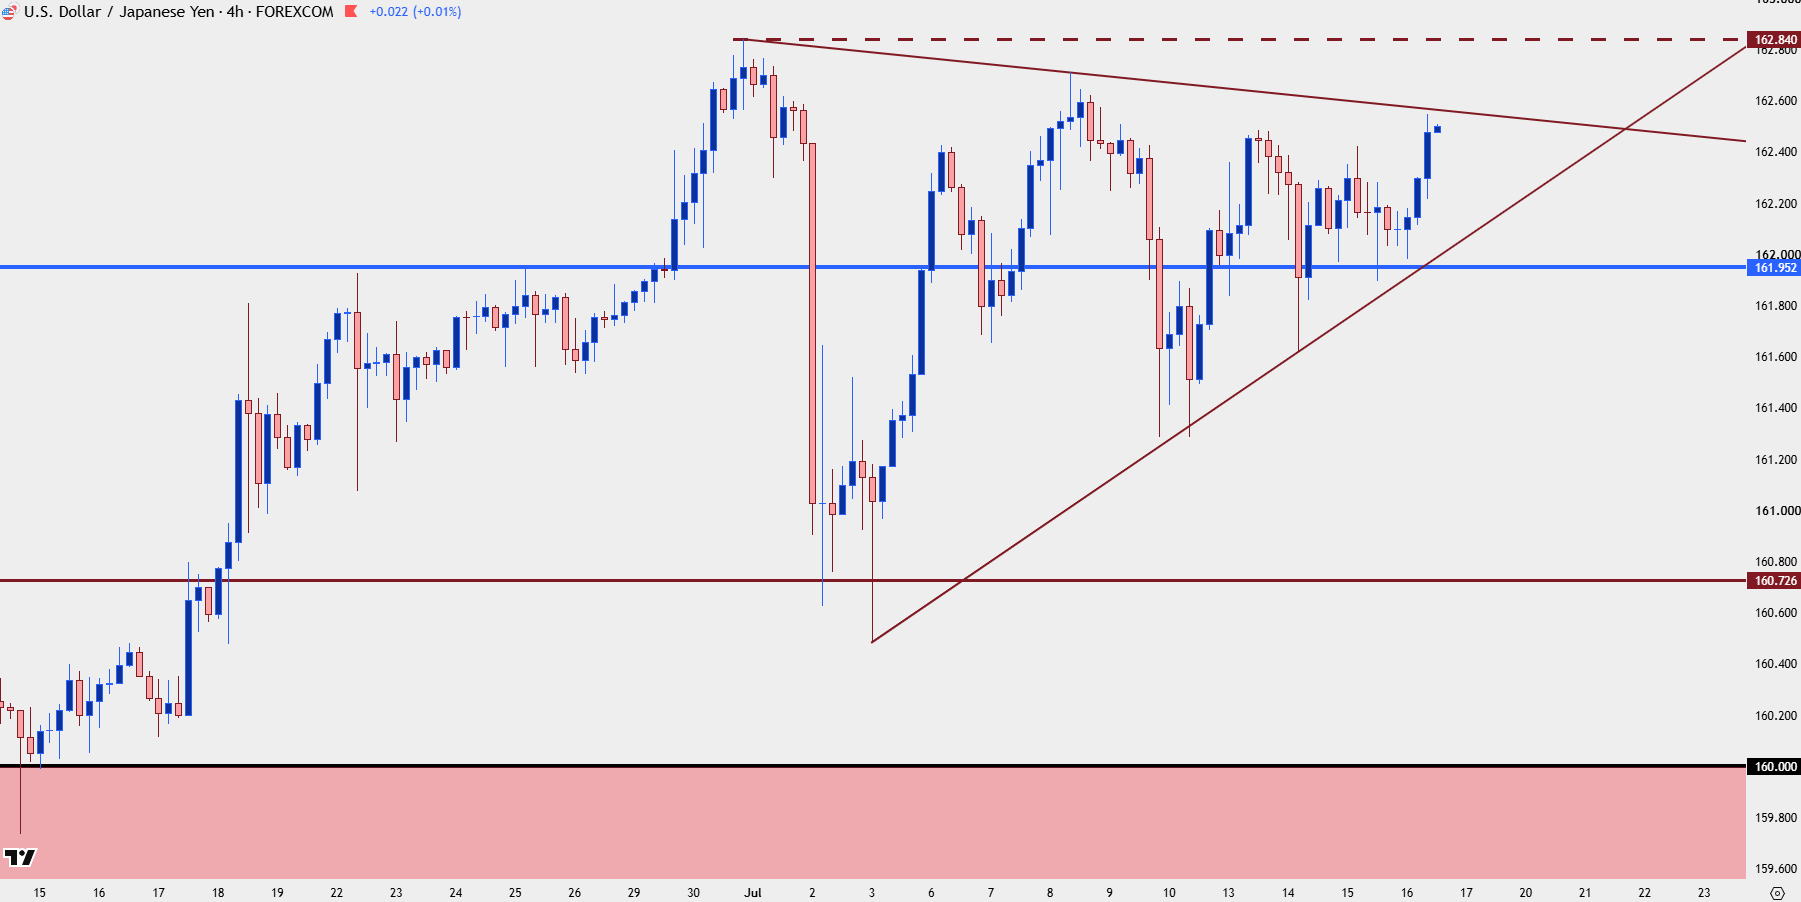
Chart prepared by James Stanley; data derived from Tradingview
Friday Fireworks
Going into the weekend presents a couple of risks as Japan closes for the week well ahead of the US, and this raises the possibility of a resistance test and perhaps even a breakout while much of the country is on their way into the weekend. For something like this, where there’s like a litany of stops sitting around or just above 163.00, that can fast turn into a short-squeeze type of scenario that propels price up towards a 165.00 type of area.
That outcome is, unfortunately, difficult to trade at this point given how close price already is to resistance.
But perhaps more enticing is if we do see some form of threat of intervention or tighter policy, a pullback can similarly be seen as opportunistic, much like I referred to on Monday when looking ahead to US CPI and PPI data.
--- written by James Stanley, Senior Market Analyst, Global Macro
Related tags:







Web Trader platform
Our sophisticated web-based platform is packed with features.
Open an account today
Experience award-winning platforms with fast and secure execution.
Economic calendar
Related articles

USD/JPY weekly outlook: Payrolls may challenge the Fed’s hawkish reset
USD/JPY has finally woken from its slumber. Payrolls now loom as the key test of whether the latest hawkish repricing sticks or sinks.


Japanese Yen Forecast: USD/JPY Survives 5% Intervention Plunge – Uptrend at Risk 8 25 2026
USD/JPY remains perched above major trend support as intervention risk and Jackson Hole raise the stakes for the next directional move.


FX Futures Positioning: USD Falls, CAD Strengthens, JPY Shorts Return | COT Report
USD weakness, rising CAD demand and renewed JPY shorts shape this week’s COT report ahead of Jackson Hole.
