


ASX 200 Market Outlook: CBA Looks Set to Bounce, Make or Break for BXB
CBA eyes a short-term rebound, while Brambles sits on a crucial support cluster. ASX 200 steadies ahead of the FOMC as seasonal tailwinds approach.
Written by
Matt Simpson
Market Analyst
The ASX 200 continues to consolidate ahead of the FOMC meeting, with tight ranges and falling implied volatility helping to stabilise sentiment. Seasonal trends typically strengthen from mid-December, adding another layer of support for local equities. Today’s focus is on two key index heavyweights — Commonwealth Bank, which looks positioned for a short-term rebound, and Brambles, which is sitting at a critical make-or-break support zone.
View related analysis:
ASX 200 Market Outlook: CBA Bounce Builds as BXB Hits Key Support
ASX 200 Market Snapshot
- The ASX 200 cash index stabilised ahead of the FOMC meeting, forming a doji on Wednesday.
- Eight of eleven sectors declined, led by Telecoms (XTJ) and Industrials (XNJ), while Consumer Staples (XSJ) and Consumer Discretionary (XDJ) outperformed.
- Daily ranges have remained unusually tight for seven sessions as the index holds within a sideways consolidation.
- A stronger lead from Wall Street should see the ASX open higher today.
- Implied volatility continues to drift lower, which may favour further gains — particularly as we approach mid-December when “Santa rally” seasonality typically strengthens.

Chart analysis by Matt Simpson - source: ASX, LSEG

Brambles (BXB) Technical Analysis
The bullish bias I outlined in November worked for a while, but momentum has since turned lower. The daily chart shows BXB still trading within a bearish channel, although a cluster of support is now in play and could fuel a short-term countertrend bounce.
A small rickshaw man doji formed on Wednesday around key support, including the August VPOC (22.85), a high-volume node at 22.90 and the 200-day averages. With volume rising for a fourth straight session and now above average, it hints at a shift from bearish to bullish control given the narrow trading range and flat close.
A break above 23.16 would strengthen the case for a countertrend move, targeting the monthly pivot near 24 or the upper boundary of the bearish channel.
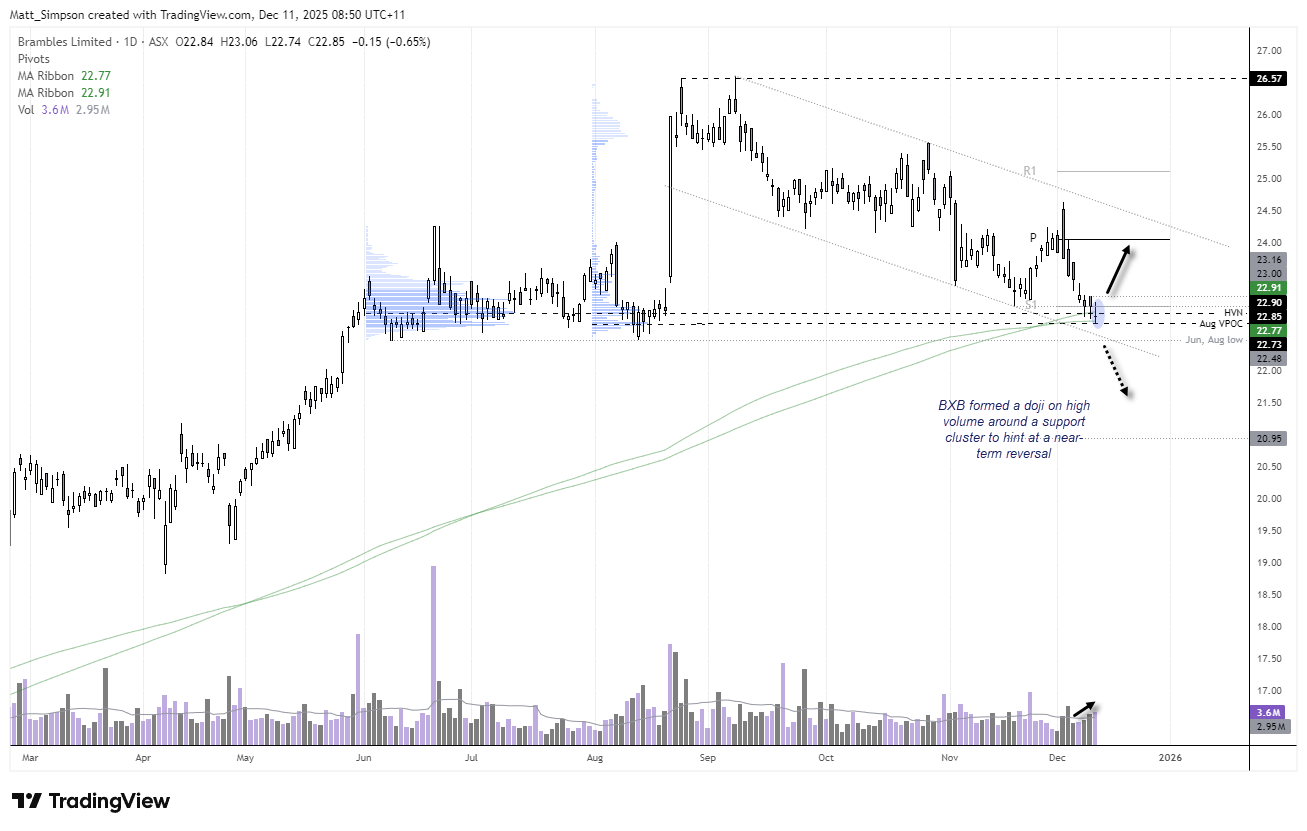
Chart analysis by Matt Simpson - Source: TradingView

Commonwealth Bank (CBA) Technical Analysis
With the RBA turning more hawkish and the dominant trend still lower, my medium-term bias remains for CBA to eventually break below 150. Such a move would likely exert pressure on the broader ASX 200. For now, though, CBA continues to hold above support, and with SPI futures firmer overnight, the near-term bias has shifted modestly bullish.
A double bottom has formed around the 150 handle and the 20-month EMA. Price remains range-bound, but the structure leans more toward quiet accumulation than distribution.
Bulls may look for a move towards 160 in the near term. A break above 160 would draw focus towards the 200-day EMA (165.67), the February low and a nearby high-volume node.
Further out, downside risk remains towards at least 140.
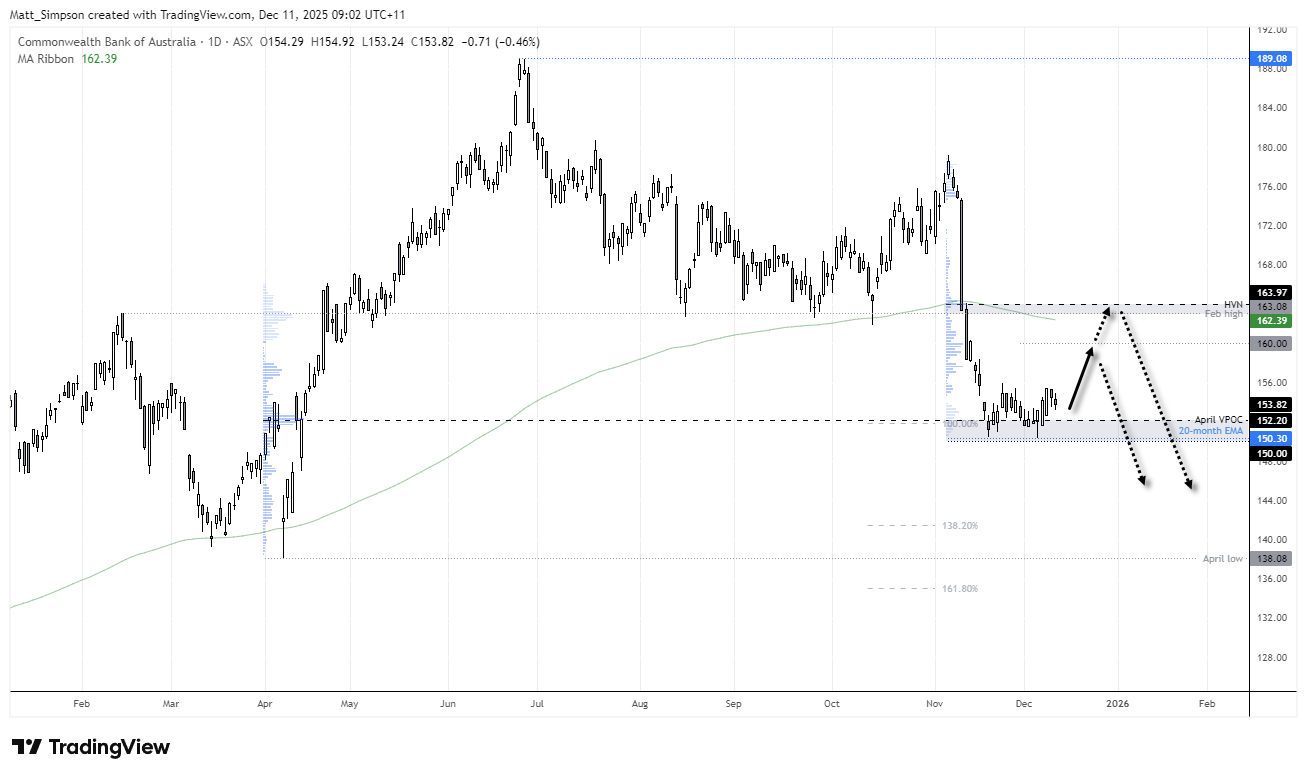
Chart analysis by Matt Simpson - Source: TradingView
ASX 200 Futures (SPI 200) Technical Analysis
A strong lead from Wall Street following the latest Fed cut pushed ASX 200 futures higher overnight. Price has reclaimed the 200-day SMA and sits just above the 200-day EMA. A countertrend move toward 8700 is possible before sellers return. As we move into mid-December, the probability of a seasonal Santa rally increases.
Historically, the ASX outperforms Wall Street in December on both median and average returns. Should this repeat, bulls may consider 8570, 8780 and 8840 as viable upside levels.
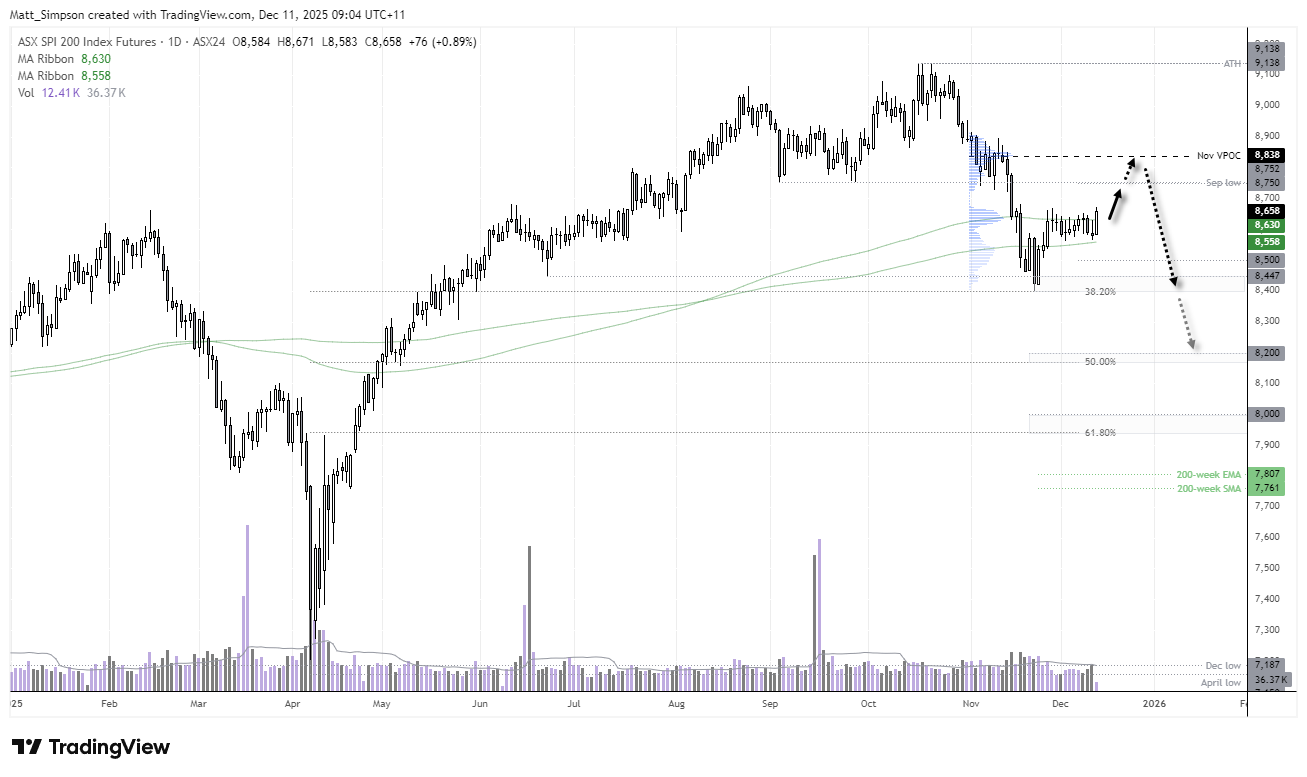
Chart analysis by Matt Simpson - Source: TradingView, ASX SPI 200 Index Futures
View the full economic calendar
-- Written by Matt Simpson
Follow Matt on Twitter @cLeverEdge
How to trade with City Index
You can trade with City Index by following these four easy steps:
- Open an account, or log in if you’re already a customer
• Open an account in the UK
• Open an account in Australia
• Open an account in Singapore
- Search for the market you want to trade in our award-winning platform
- Choose your position and size, and your stop and limit levels
- Place the trade
Related tags:






Web Trader platform
Our sophisticated web-based platform is packed with features.
Open an account today
Experience award-winning platforms with fast and secure execution.
Economic calendar
Related articles

Euro Short-term Outlook: EUR/USD Pullback Nears Pivotal Uptrend Support 8 28 2026
Warsh's comments accelerated the EUR/USD selloff, raising the stakes as buyers look to stabilize the broader recovery.

Gold and S&P 500 analysis: What now after Warsh’s hawkish speech?
The dollar surged across the board after the Fed Chair Kevin Warsh surprised with a hawkish-leaning speech at the Jackson Hole summit. All the bearish dollar bets that had been accumulated since last Friday on the back of data weakness and bond market troubles had to be squared and that triggered a short squeeze rally for the dollar. Gold and silver dropped, as a result, as too did bitcoin, while US indices were giving back earlier gains.


EUR/USD forecast: All eyes on Warsh at Jackson Hole - Forex Friday
For much of this week, the EUR/USD has been edging lower with the US dollar regaining some ground after last week’s sell-off that was triggered, in part, by the bond market worries. Investors have been unwilling to bet further against the US dollar so far this week ahead of Kevin Warsh’s keynote speech at the Jackson Hole summit, due later today.