



Australian Dollar Forecast: AUD/USD Falls to Fresh Yearly Low
AUD/USD clears the August low (0.6349) to register a fresh yearly low (0.6337).
Written by
David Song
Strategist
Australian Dollar Outlook: AUD/USD
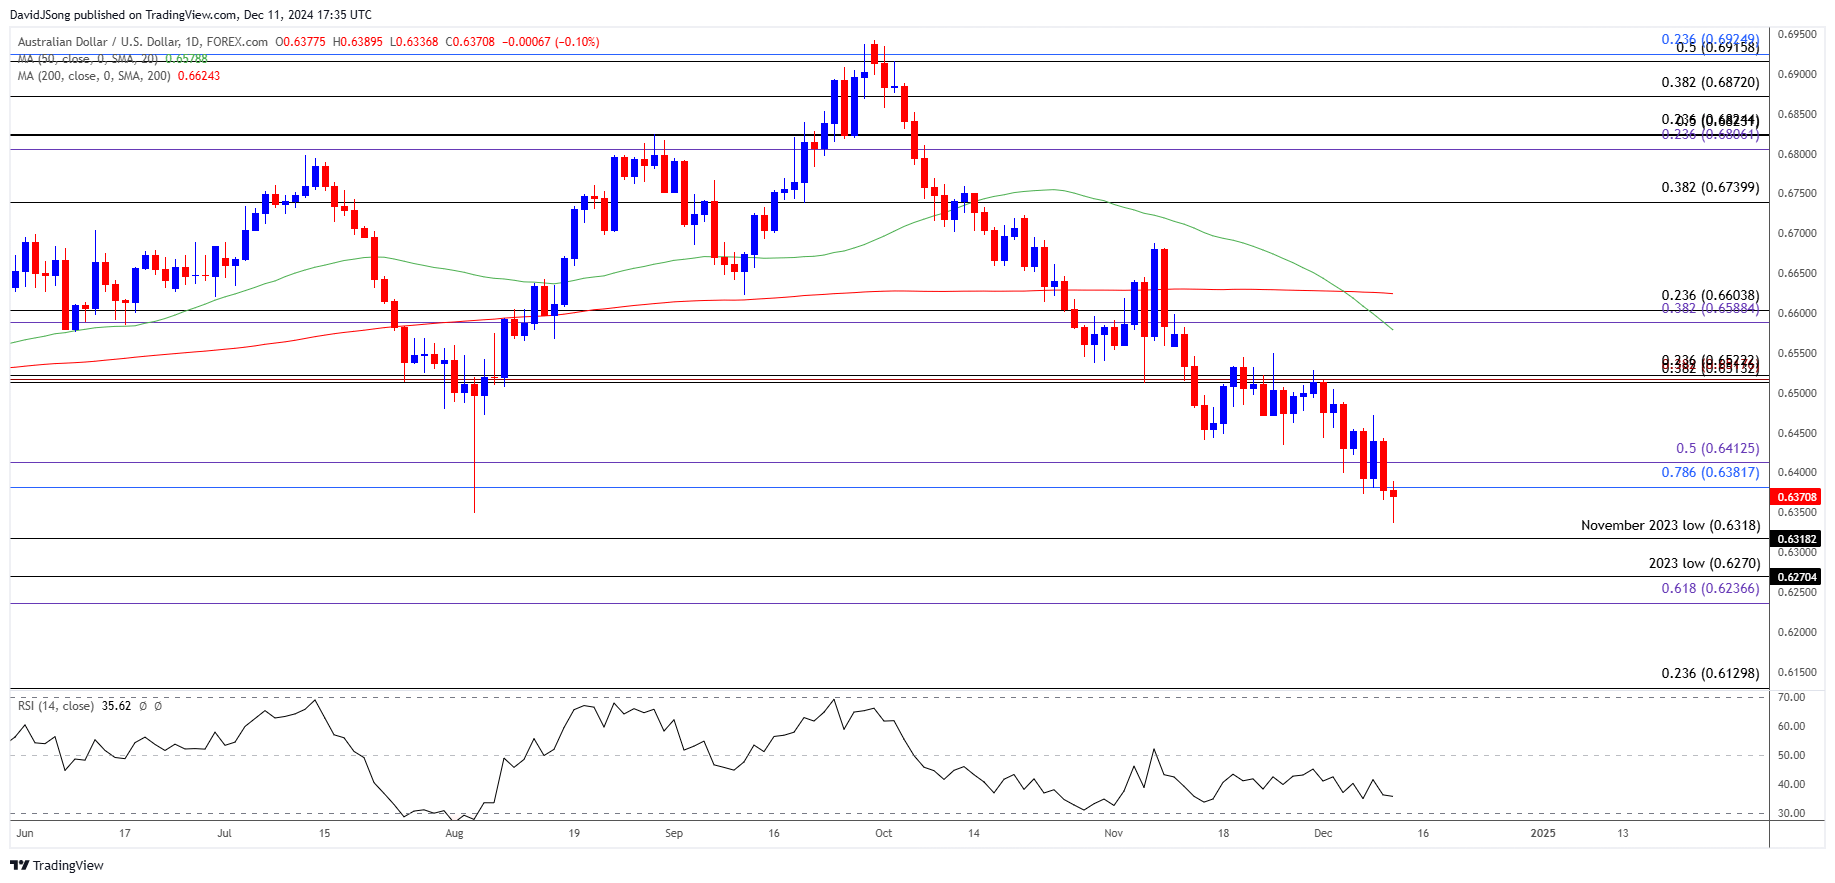
AUD/USD clears the August low (0.6349) to register a fresh yearly low (0.6337), and the exchange rate appears to be on track to test the November 2023 low (0.6318) as it carves a series of lower highs and lows.
Australian Dollar Forecast: AUD/USD Falls to Fresh Yearly Low
Keep in mind, AUD/USD struggled to hold its ground following the Reserve Bank of Australia (RBA) meeting as the central bank revealed that ‘the Board is gaining some confidence that inflation is moving sustainably towards target’ after keeping the cash rate at 4.35%.
Join David Song for the Weekly Fundamental Market Outlook webinar.
The comments suggest the RBA is getting closer to changing gears after keeping interest rates on hold throughout 2024, but data prints coming out of Australia may encourage Governor Michele Bullock and Co. to further combat inflation as the employment report is anticipated to show a resilient labor market.
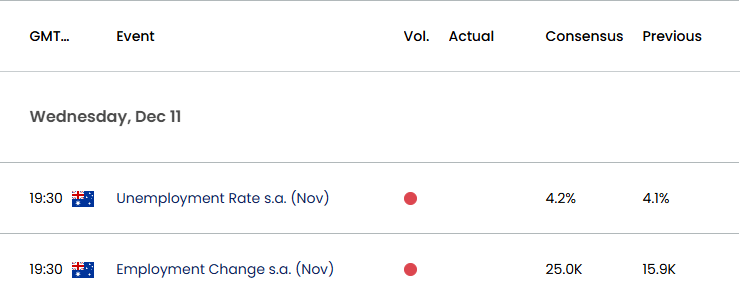
Australia Economic Calendar
Australia is expected to add 25.0K jobs in November following the 15.9K expansion the month prior, and a positive development may generate a bullish reaction in the Australian Dollar as it raises the RBA’s scope to further combat inflation.
With that said, another rise in Australia Employment may curb the recent weakness in AUD/USD, but the exchange rate may attempt to test the November 2023 low (0.6318) should the bearish price series may persist.
AUD/USD Price Chart – Daily
Chart Prepared by David Song, Strategist; AUD/USD on TradingView
- AUD/USD trades to a fresh yearly low (0.6337) after closing below the 0.6380 (78.6% Fibonacci retracement) to 0.6410 (50% Fibonacci extension) zone for the first time in 2024, with a breach below the November 2023 low (0.6318) bringing the 0.6240 (61.8% Fibonacci extension) to 0.6270 (2023 low) region on the radar.
- Next area of interest comes in around 0.6130 (23.6% Fibonacci retracement), but lack of momentum to below the November 2023 low (0.6318) may keep the Relative Strength Index (RSI) above oversold territory.
- Need a move above the 0.6380 (78.6% Fibonacci retracement) to 0.6410 (50% Fibonacci extension) zone for AUD/USD to clear the bearish price series, with a break/close above the 0.6510 (38.2% Fibonacci retracement) to 0.6520 (23.6% Fibonacci retracement) region bring the 0.6590 (38.2% Fibonacci extension) to 0.6600 (23.6% Fibonacci retracement) area back on the radar.
Additional Market Outlooks
US Dollar Forecast: USD/JPY Rallies Ahead of US CPI Report
EUR/USD Monthly Opening Range Intact Ahead of ECB Rate Decision
USD/CAD Forecast: Canadian Dollar Vulnerable to BoC Rate Cut
GBP/USD Remains Susceptible to Bear Flag Formation
--- Written by David Song, Senior Strategist
Follow on X at @DavidJSong
Related tags:









Web Trader platform
Our sophisticated web-based platform is packed with features.
Open an account today
Experience award-winning platforms with fast and secure execution.
Economic calendar
Related articles

Australian Dollar Outlook: AUD/USD Faces RBA-Fed Rate Tug-of-War
AUD/USD faces competing RBA and Fed hike bets this week, with Australian GDP and US payrolls set to test the eight-week rally.

Euro Short-term Outlook: EUR/USD Pullback Nears Pivotal Uptrend Support 8 28 2026
Warsh's comments accelerated the EUR/USD selloff, raising the stakes as buyers look to stabilize the broader recovery.


Gold and S&P 500 analysis: What now after Warsh’s hawkish speech?
The dollar surged across the board after the Fed Chair Kevin Warsh surprised with a hawkish-leaning speech at the Jackson Hole summit. All the bearish dollar bets that had been accumulated since last Friday on the back of data weakness and bond market troubles had to be squared and that triggered a short squeeze rally for the dollar. Gold and silver dropped, as a result, as too did bitcoin, while US indices were giving back earlier gains.
