


Australian Dollar Outlook: AUD/USD Bounce Lacks Conviction as ISM, FOMC Loom
AUD/USD snapped a four-week losing streak, but the bounce lacks conviction as traders eye ISM services, FOMC minutes and resistance near 0.7000.
Written by
Matt Simpson
Market Analyst
AUD/USD finally snapped its four-week losing streak, but the recovery has done little to alter the broader technical picture. With resistance clustered just below 0.7000 and a quiet Australian calendar shifting attention to US data and the FOMC minutes, traders may need a fresh catalyst before the next meaningful move develops.
View related analysis:
Australia This Week: Economic Data and Events for AUD/USD Traders
A Quiet Calendar Leaves Traders Awaiting Fresh Catalysts
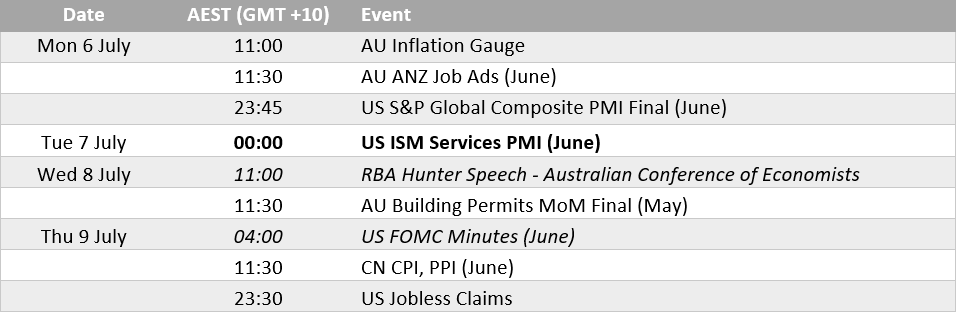
It is a quieter calendar than usual for Australia, with only a handful of second-tier events at best. The inflation gauge, job ads and final building permits are nice to know, but are unlikely to be market moving unless a surprise plunge in job ads surfaces. Unless Assistant RBA Governor Hunter reveals anything beyond the RBA's view that it is likely to retain a slightly hawkish bias while remaining on hold for now, her speech on Wednesday seems unlikely to be a market mover.
The same could be said for the FOMC minutes. We know the Fed delivered a hawkish hold, and recent comments from officials have also leaned hawkish. However, the slightly softer-than-expected NFP report has eased some of the immediate pressure for the Fed to act. Ultimately, Fed funds futures still imply just under a 50% chance of a September hike, although that is slightly lower than this time last week. Incoming data are likely to sway expectations more than the FOMC minutes can. That said, expect headlines if the minutes reveal more members were leaning towards a hawkish stance.
US Dollar Outlook: Focus Shifts to ISM Services
NFP data were softer than expected without being a disaster. While just 57k jobs were added compared with the 114k expected (and the prior reading was revised down to 129k from 172k), the unemployment rate still fell to 4.2%. Yet with traders clearly positioned for a stronger report, the data weighed on the US dollar and helped AUD/USD rise last week.
Attention now shifts to the ISM services report, which could further dampen expectations of a September Fed hike if it also disappoints. More broadly, the data only need to be weaker than expected rather than weak in absolute terms for traders to trim the odds of another Fed hike this year. Unless we're thrown a curveball, global markets could remain relatively subdued this week.

AUD/USD Technical Analysis: Australian Dollar vs US Dollar
AUD/USD Correlations
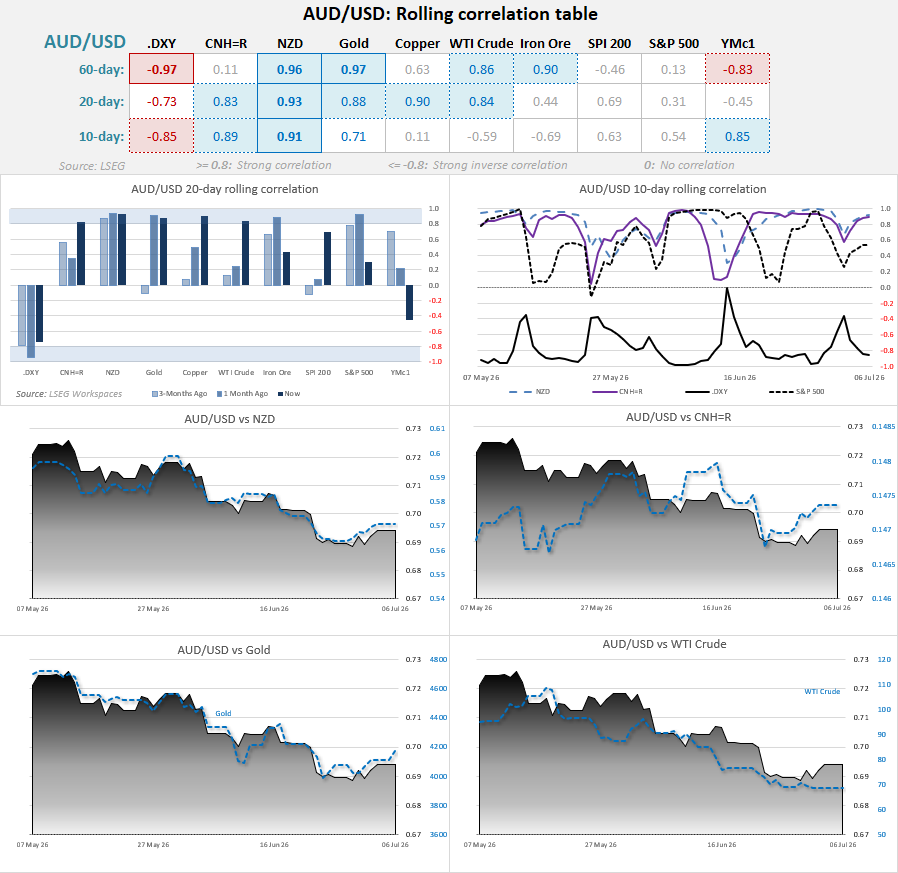
Looking through the charts shows that some of the classic correlations are more or less holding together. While the relationship with gold remains tight, crude oil is yet to follow in its footsteps—a theme I hinted at on Friday. Elsewhere, its correlation with the Chinese yuan has intensified and remains tight against the New Zealand dollar, but has weakened against the US dollar. Wall Street is sending mixed signals, with the S&P 500 and Nasdaq lagging behind the Dow Jones.
Source: LSEG
AUD/USD technical outlook: Resistance building near 0.7000
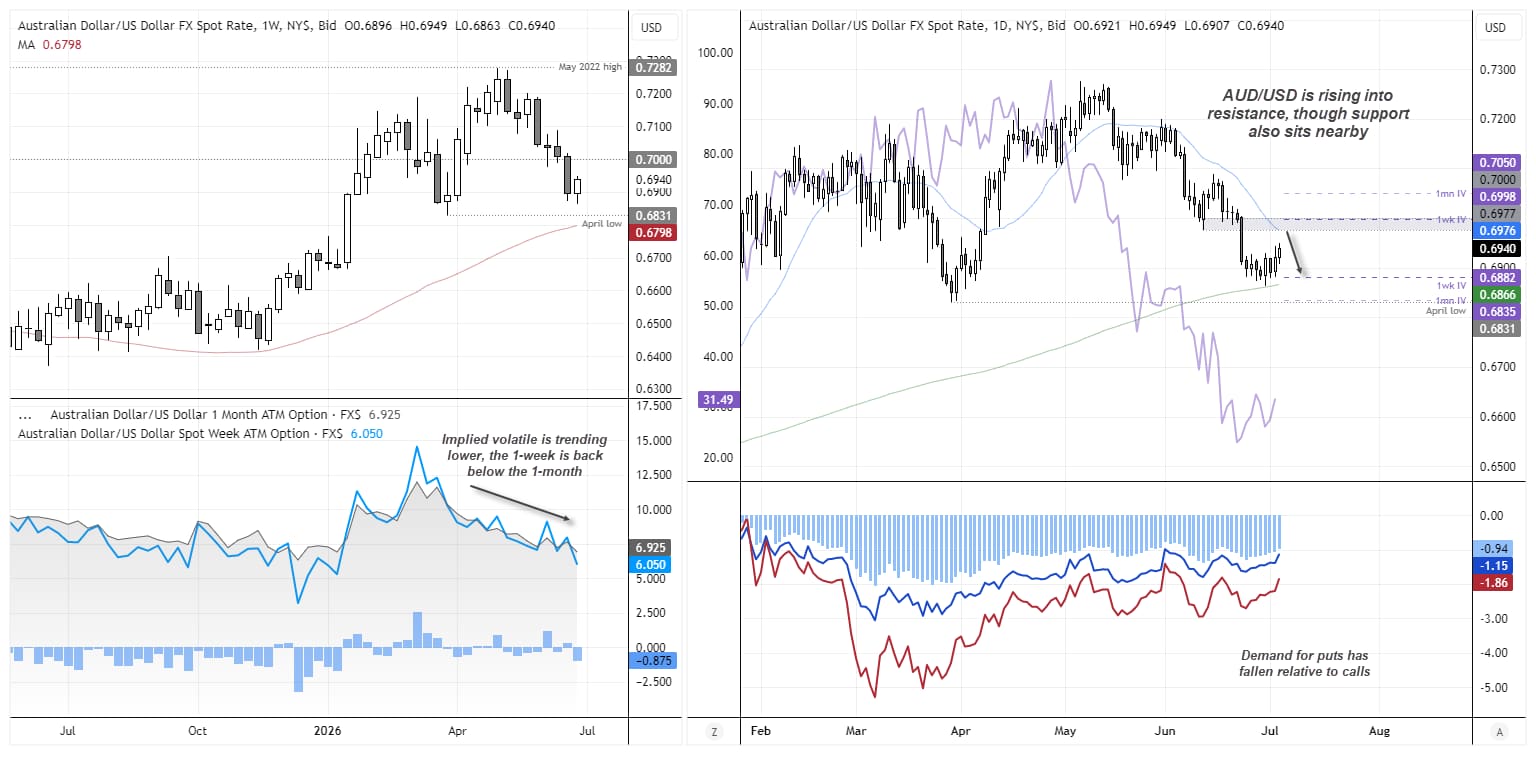
The Aussie snapped a four-week losing streak, although its rebound was far from impressive, with last week's range failing to exceed the previous week's. Still, I felt the odds of at least a minor rebound were high, even if bulls failed to fully regain control.
Ultimately, AUD/USD remains in a downtrend on the daily chart, while the AU–US two-year yield differential remains relatively low despite recovering last week. There are also plenty of resistance levels overhead. And with the US dollar showing signs of perking up, while options traders continue to show less demand for puts than calls than they did two weeks ago, bears may be on guard for evidence of a swing high.
Note that the upper 1-week implied volatility band sits just below 70c and the 20-day SMA sits right on the June 11 low, making 0.6976 – 0.7000 a potential resistance zone.
Yet with the 200-day SMA around recent lows and above the April high, I’m also not seeking an excessively bearish move for now given AUD/SUD has already fallen 5.7% from its May high.
Source: ICE, TradingView

Australian Dollar Performance
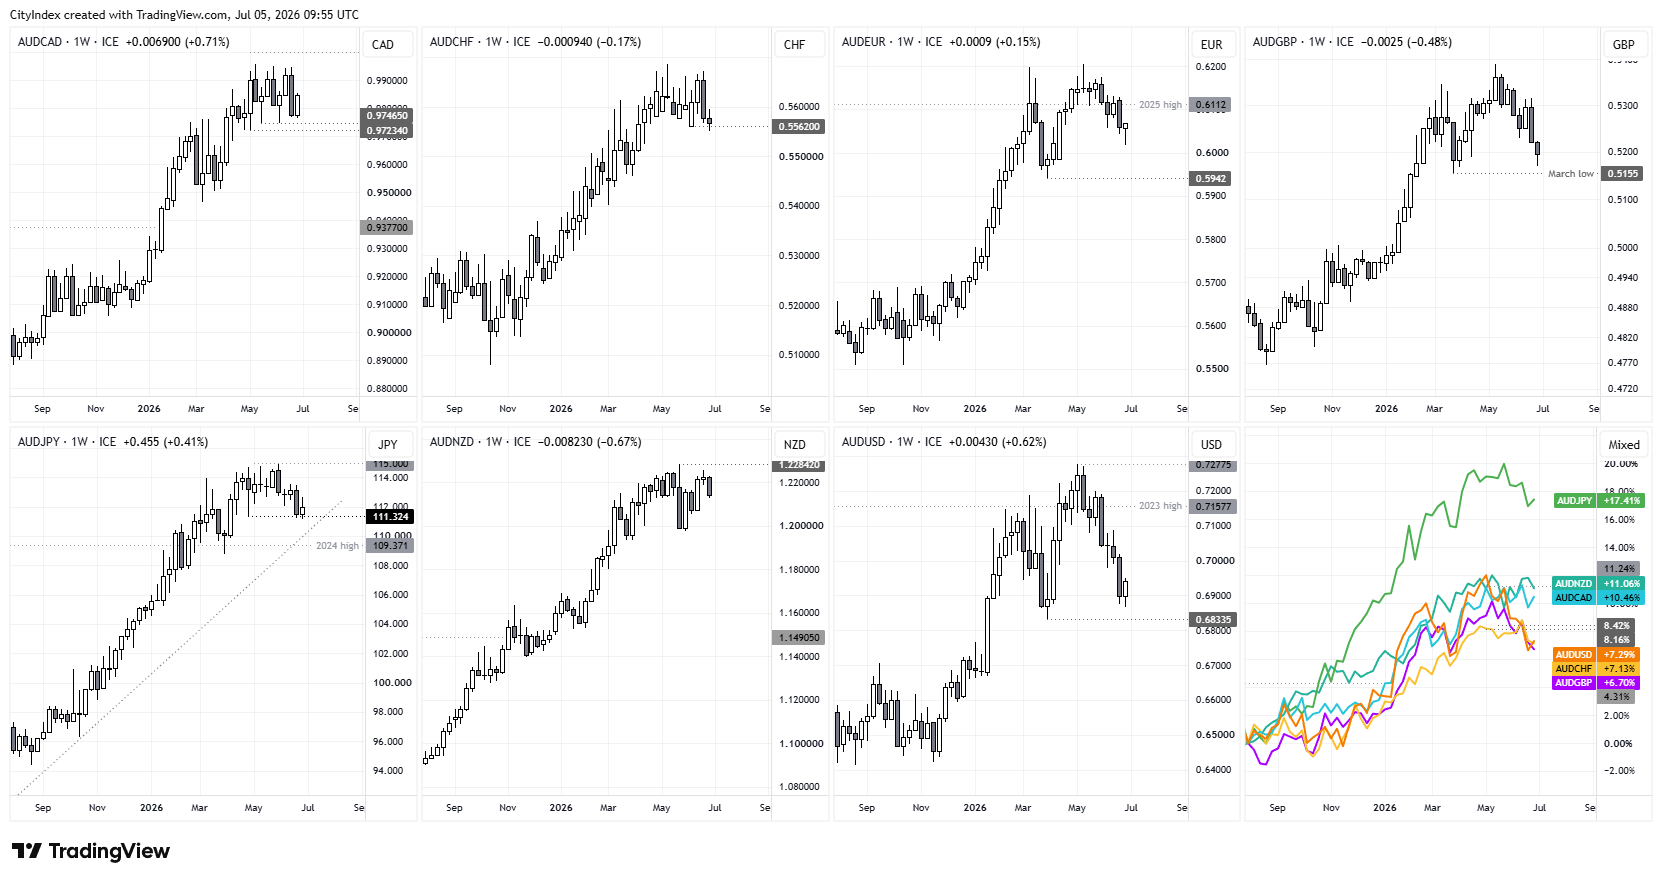
It was another mixed week for the Aussie across the majors, losing ground to the New Zealand dollar, British pound and Swiss franc (to varying degrees). The same could be said of its gains against the Canadian dollar, Japanese yen and euro. I suspect we may be in for a quiet month of choppy trade and mixed reactions unless a fresh macro catalyst arrives.
Source: ICE, TradingView
- AUD/USD: Snapped a four-week losing streak with a narrow-range candle, keeping me on guard for a potential move towards 70c.
- AUD/CAD: Held above its 0.9750 double bottom and remained within a sideways range, despite the broader bullish trend.
- AUD/CHF: A small doji around 0.55 signals waning bearish momentum despite the previous week's bearish engulfing candle, making it an unconvincing sell signal within a strong uptrend.
- AUD/EUR: A small bullish hammer warns that the correction against the euro may be nearing an end.
- AUD/GBP: A narrower bearish candle suggests sellers are losing momentum, while its long lower wick (around 50% of the total range) shows buyers are pushing back against the British pound.
- AUD/JPY: Narrowly held above the April low. Even if it breaks lower, support around the 110 handle or the April 2025 trendline could limit further losses.
- AUD/NZD: Formed a small bearish hammer ahead of last week's decline, warning of further near-term weakness.
View the full economic calendar
-- Written by Matt Simpson
Follow Matt on Twitter @cLeverEdge
How to trade with City Index
You can trade with City Index by following these four easy steps:
- Open an account, or log in if you’re already a customer
• Open an account in the UK
• Open an account in Australia
• Open an account in Singapore
- Search for the market you want to trade in our award-winning platform
- Choose your position and size, and your stop and limit levels
- Place the trade







Web Trader platform
Our sophisticated web-based platform is packed with features.
Open an account today
Experience award-winning platforms with fast and secure execution.
Economic calendar
Related articles

Canadian Dollar Forecast: USD/CAD Weekly Reversal Puts Yearly Uptrend Back in Focus 8 29 2026
USD/CAD has staged its strongest weekly advance since June, shifting the focus to whether a more durable low is finally taking shape.


USD/JPY weekly outlook: Payrolls may challenge the Fed’s hawkish reset
USD/JPY has finally woken from its slumber. Payrolls now loom as the key test of whether the latest hawkish repricing sticks or sinks.


Euro Short-term Outlook: EUR/USD Pullback Nears Pivotal Uptrend Support 8 28 2026
Warsh's comments accelerated the EUR/USD selloff, raising the stakes as buyers look to stabilize the broader recovery.