


Australian Dollar Price Action Setups: AUD/USD, AUD/JPY, GBP/AUD
AUD/USD range holds below 0.69, AUD/JPY tests key support, and GBP/AUD risks a pullback from resistance cluster.
Written by
Matt Simpson
Market Analyst
The Australian dollar continues to hold firm across major pairs, but momentum is starting to diverge beneath the surface. While AUD/USD remains trapped within a well-defined range, AUD/JPY is testing key support within its broader uptrend, and GBP/AUD is flashing signs of a potential swing high.
These setups point to a market at an inflection point, where range strategies remain valid for now—but breakout or reversal risks are building across key AUD crosses.
AUD Setups: Range Trading AUD/USD, Support in AUD/JPY, GBP/AUD at Resistance
AUD/USD Technical Analysis: Australian Dollar vs US Dollar
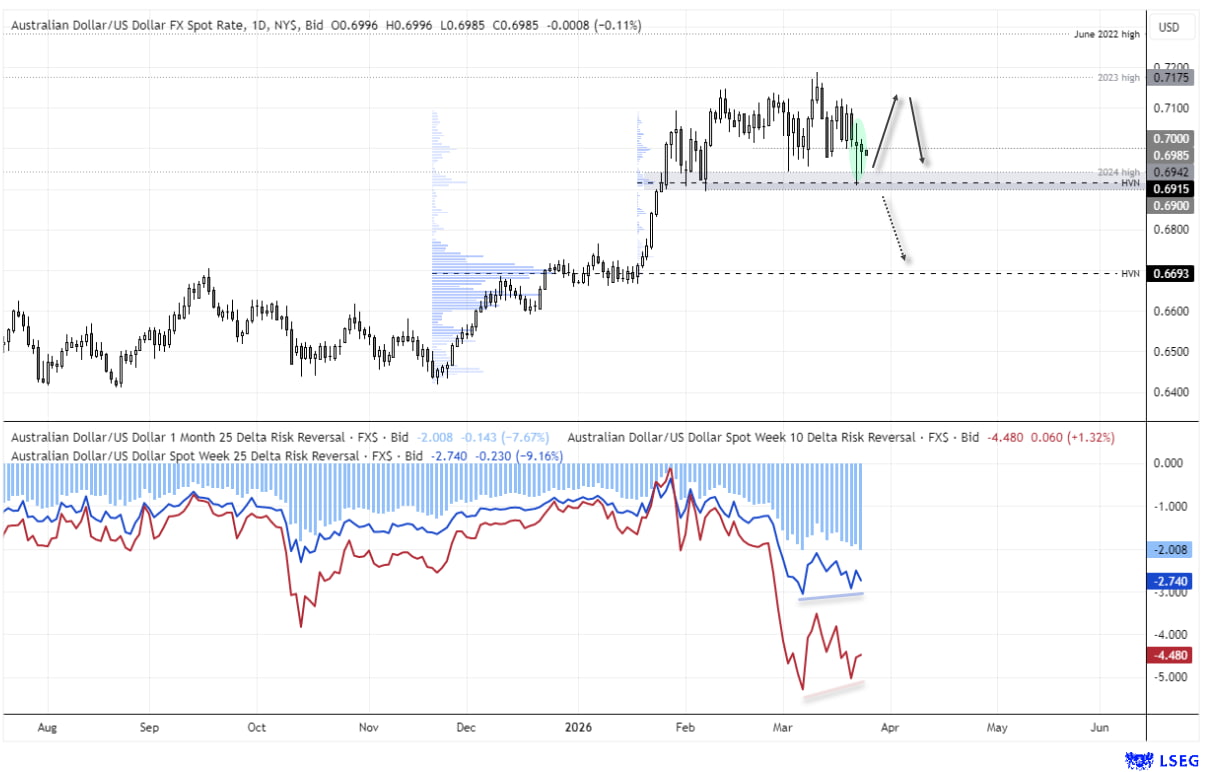
The battler has continued to defy gravity in recent weeks despite many calling – myself included – with a pullback. Yet AUD/USD has lacked the basic step of breaking outside of its choppy range between the 2024 and 2023 highs. And until it does, range-trading strategies are preferred on Australian dollar.
Monday’s long-legged doji respected a high-volume node (HVN) without quite touching the 69c and reverting higher. Tuesday’s inside candle is a small bullish hammer to suggest bullish pressure could be building within its choppy range.
While options traders continue to price in the worse and lean heavily towards downside protection, the downside tail risk is actually forming a bullish divergence with AUD/USD prices. SO until we see a break or daily close beat 69c, AUD/USD stands chance of a bounce.
Source: LSEG
GBP/AUD Technical Analysis: British Pound vs Australian Dollar
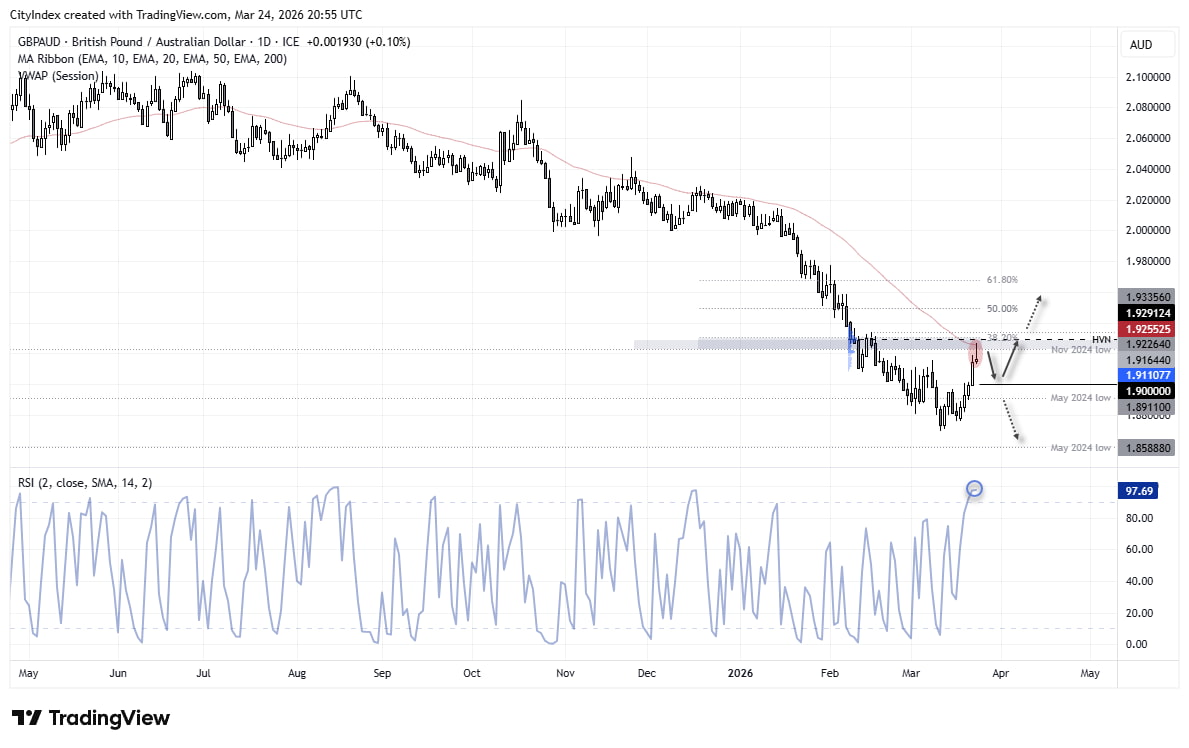
While the British pound has been benefiting from a countertrend bounce against the Australian dollar, a swing high could be forming on the GBP/AUD daily chart. A shooting star candle formed on Tuesday, with the daily high respecting the confluence of the 50-day EMA, weekly high-volume node (HVN), and 38.2% Fibonacci retracement as resistance, before closing back below the November high. Note also that RSI (2) is deeply in overbought territory.
A single candle such as a shooting star is not enough to confirm whether a return to the broader bearish trend is underway, or if this simply marks a minor pullback within a deeper corrective move higher. However, the fact it formed at a key resistance cluster increases the probability of at least a near-term pullback for GBP/AUD.
Source: ICE, TradingView
AUD/JPY Technical Analysis: Australian Dollar vs Japanese Yen
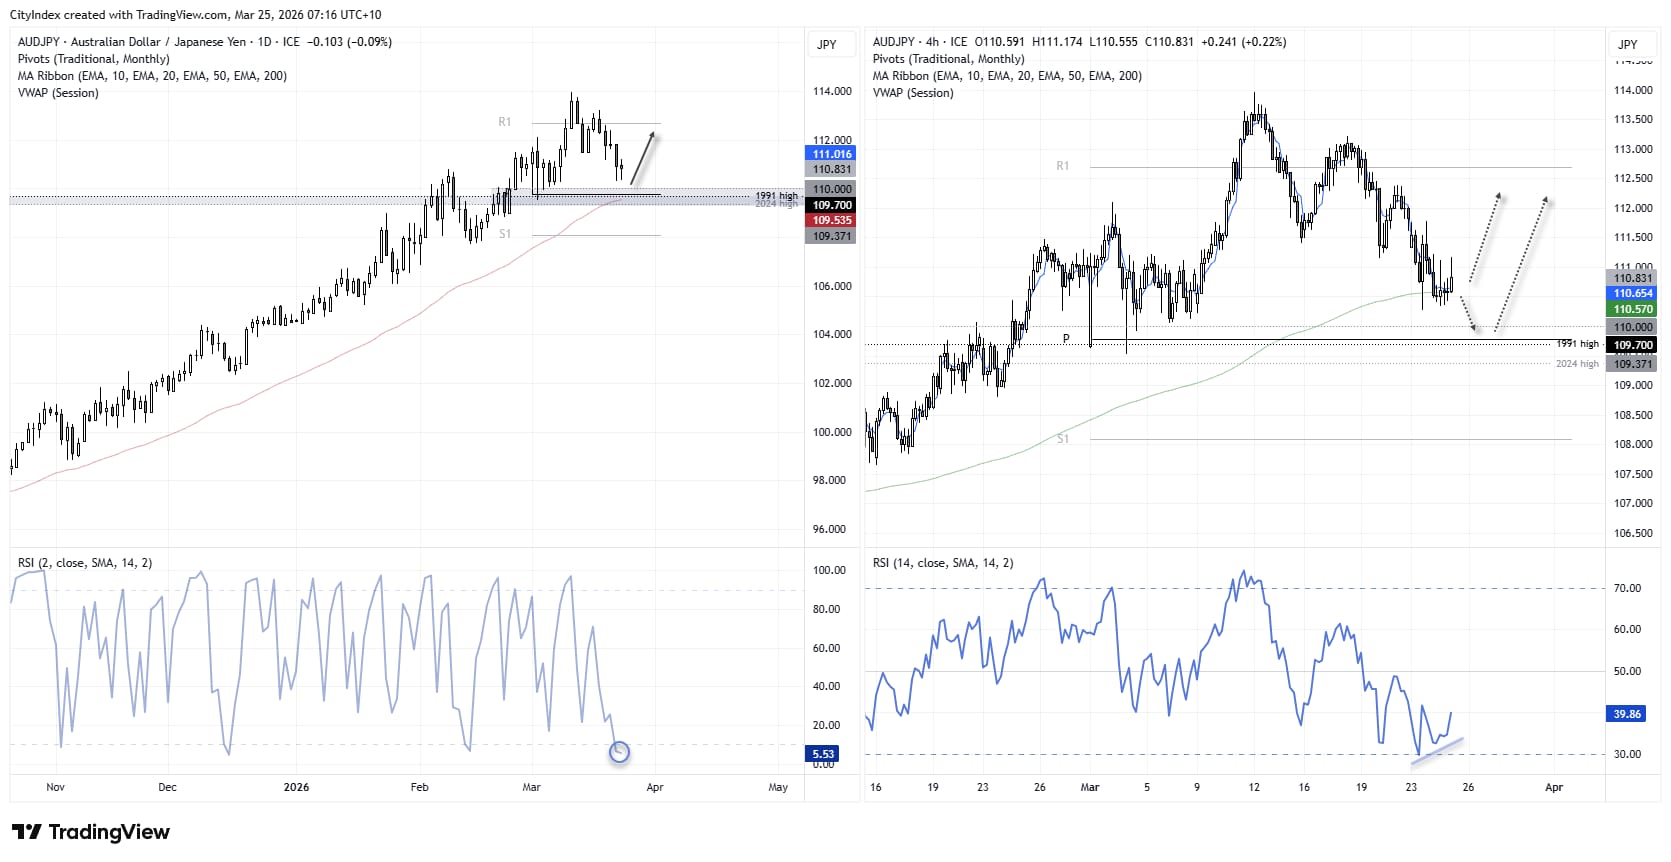
The uptrend on the daily chart for AUD/JPY remains well defined, although momentum has recently turned against it. Still, a nearby support cluster sits around the 110 handle, the 50-day EMA, and the 1991 and 2024 highs. The daily RSI (2) is also within oversold territory.
A minor bullish divergence has formed on the RSI (14) on the 4-hour chart, while prices have found support at the 200-bar EMA. Momentum is also attempting to turn higher on this timeframe.
Ultimately, I am looking for a swing low to form on AUD/JPY—whether around current levels or closer to the 110 support zone—to bring momentum back in line with the broader daily uptrend.
Source: ICE, TradingView
View the full economic calendar
-- Written by Matt Simpson
Follow Matt on Twitter @cLeverEdge
How to trade with StoneX Trading
You can trade with StoneX Trading by following these four easy steps:
- Open an account, or log in if you’re already a customer
- Search for the market you want to trade in our award-winning platform
- Choose your position and size, and your stop and limit levels
- Place the trade
Related tags:
Latest market news










Web Trader platform
Our sophisticated web-based platform is packed with features.
Open an account today
Experience award-winning platforms with fast and secure execution.
Economic calendar
Related articles

FX Futures Positioning: Dollar Rebound Meets Diverging Forex Bets | COT Report
US dollar longs held firm into Jackson Hole, while euro, yen and commodity FX positioning diverged ahead of ISM and NFP.

USD/JPY weekly outlook: Payrolls may challenge the Fed’s hawkish reset
USD/JPY has finally woken from its slumber. Payrolls now loom as the key test of whether the latest hawkish repricing sticks or sinks.


Gold and S&P 500 analysis: What now after Warsh’s hawkish speech?
The dollar surged across the board after the Fed Chair Kevin Warsh surprised with a hawkish-leaning speech at the Jackson Hole summit. All the bearish dollar bets that had been accumulated since last Friday on the back of data weakness and bond market troubles had to be squared and that triggered a short squeeze rally for the dollar. Gold and silver dropped, as a result, as too did bitcoin, while US indices were giving back earlier gains.
