

Bitcoin Back to a Familiar Support Level: BTC/USD Levels
Bitcoin has retained strength through the jump in yields even as gold has melted down, but now BTC/USD faces an important test as price has reverted to a significant support level.
Written by
James Stanley
Sr. Strategist
Bitcoin, BTC/USD Talking Points:
- BTC/USD has held up well of late, all factors considered.
- As looked at previously it appeared as though we’re in one of those periods where the world’s preference for an anti-fiat vehicle has shifted from gold to Bitcoin.
- So far, there’s been a clean hold of support at prior resistance from May – but there’s also been a hold of resistance at the high around 87,300 helping to develop a rather consistent range.
It was the Treasury buyback announcement that lit the Bitcoin market on fire, and in the month-and-a-half since, there’s been a noticeable shift from investors into the cryptocurrency and away from gold. The fact that BTC/USD has held up as well as it has, even with global yields flying higher, is a fact that should be respected. But we’re now at the point where the proverbial rubber meets the road as Bitcoin is testing a significant support level that has some historical relevance.
The level of 82,833 set the high back in May. In the week after that high, a series of lower-highs led to a breakdown and, eventually, a test of the 60k handle in July.
More recently, and perhaps more importantly, is how the level came into play last week. As gold sold off into and around the Fed’s rate hike, Bitcoin continued to power-higher, setting a fresh eight-month-high the week after the move. At that point, with a heavy bullish bias there was ample motive for sellers to drive a sizable pullback. But it was the 82,833 level where bulls took a stand, establishing a higher-low that, eventually, led to another rally.
Bitcoin (BTC/USD) Daily Price Chart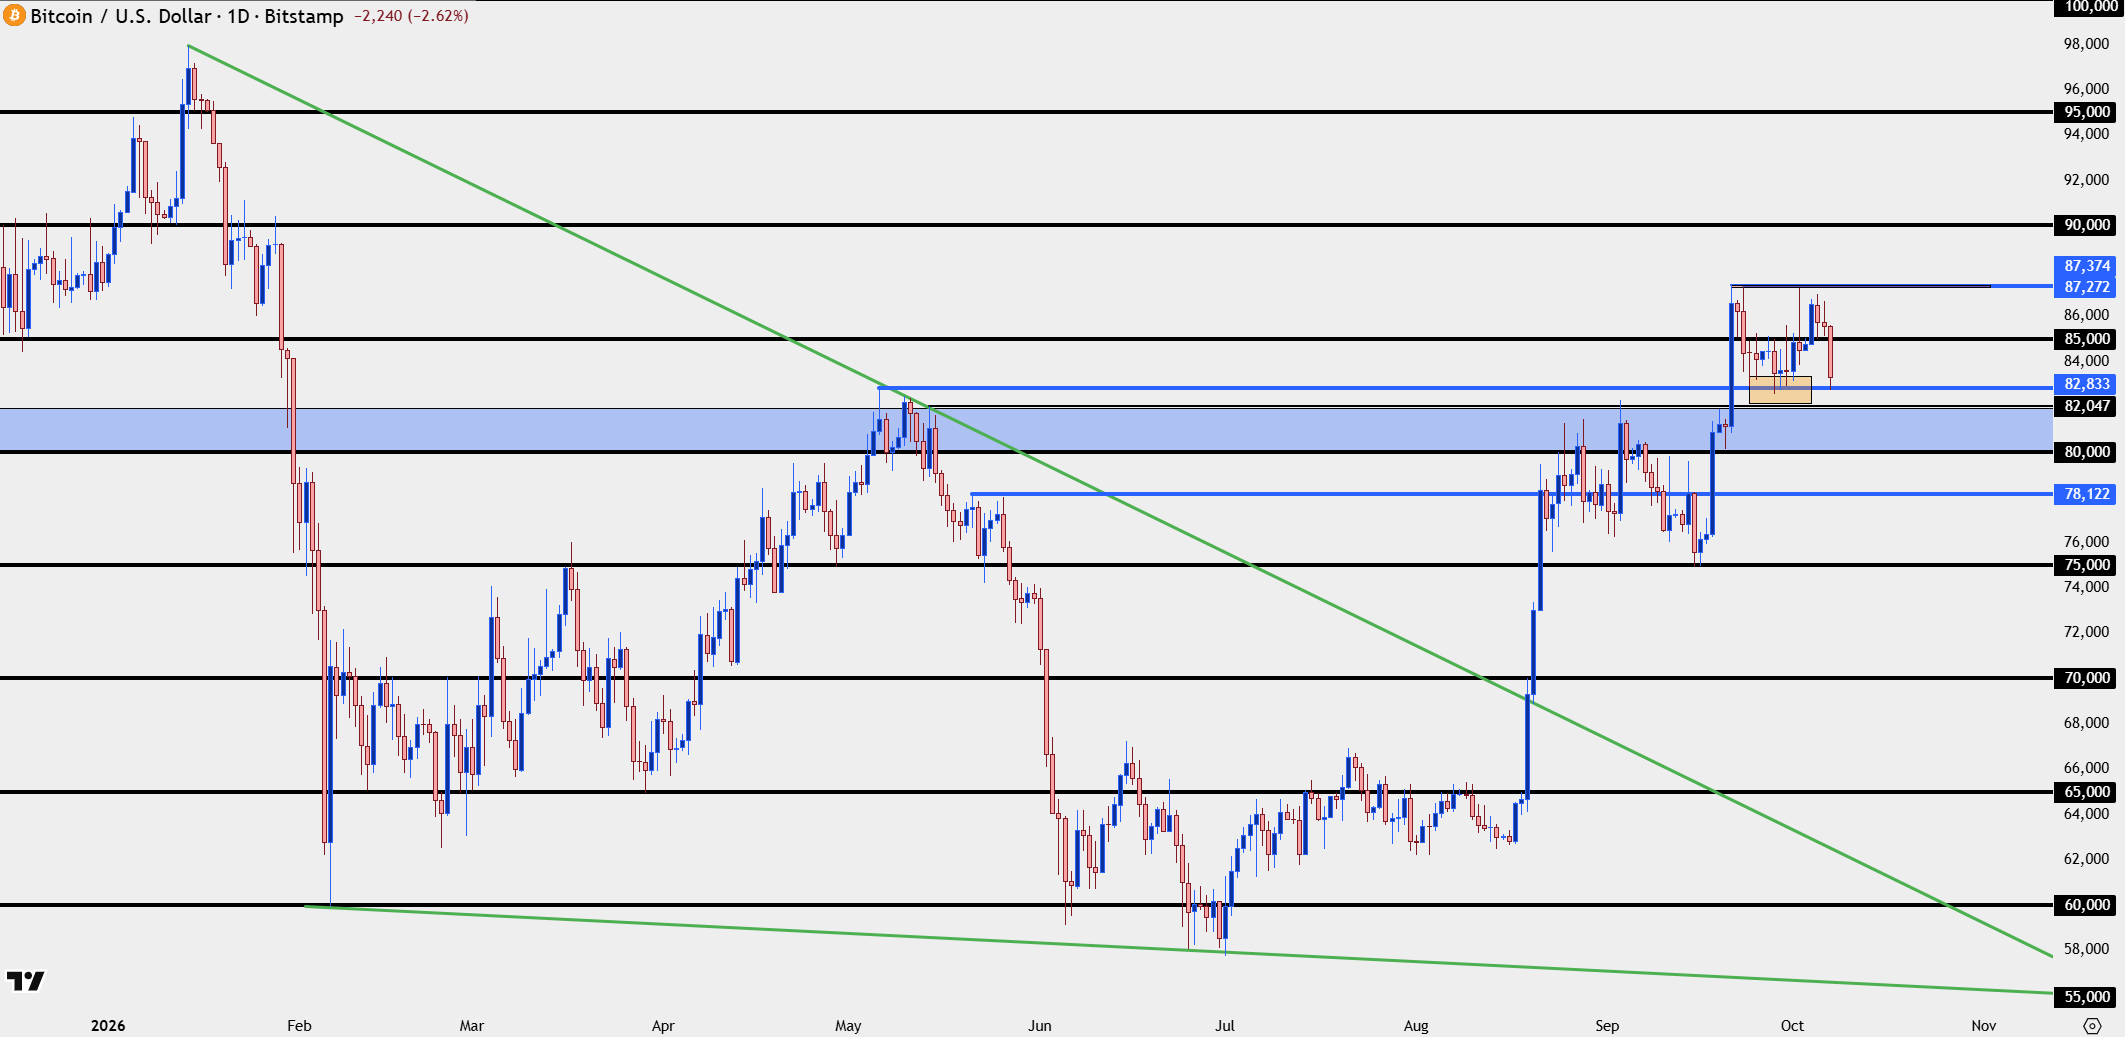
Chart prepared by James Stanley; data derived from Tradingview
Bitcoin Big Picture
From the weekly chart this is an important spot and an important time for BTC/USD. The breakout is still fresh and while invalidation doesn’t exist until 75k, the weekly bar closing as bearish as it looks now would be foreboding, and would highlight the potential for a deeper drawdown to the 80k level.
BTC/USD Weekly Chart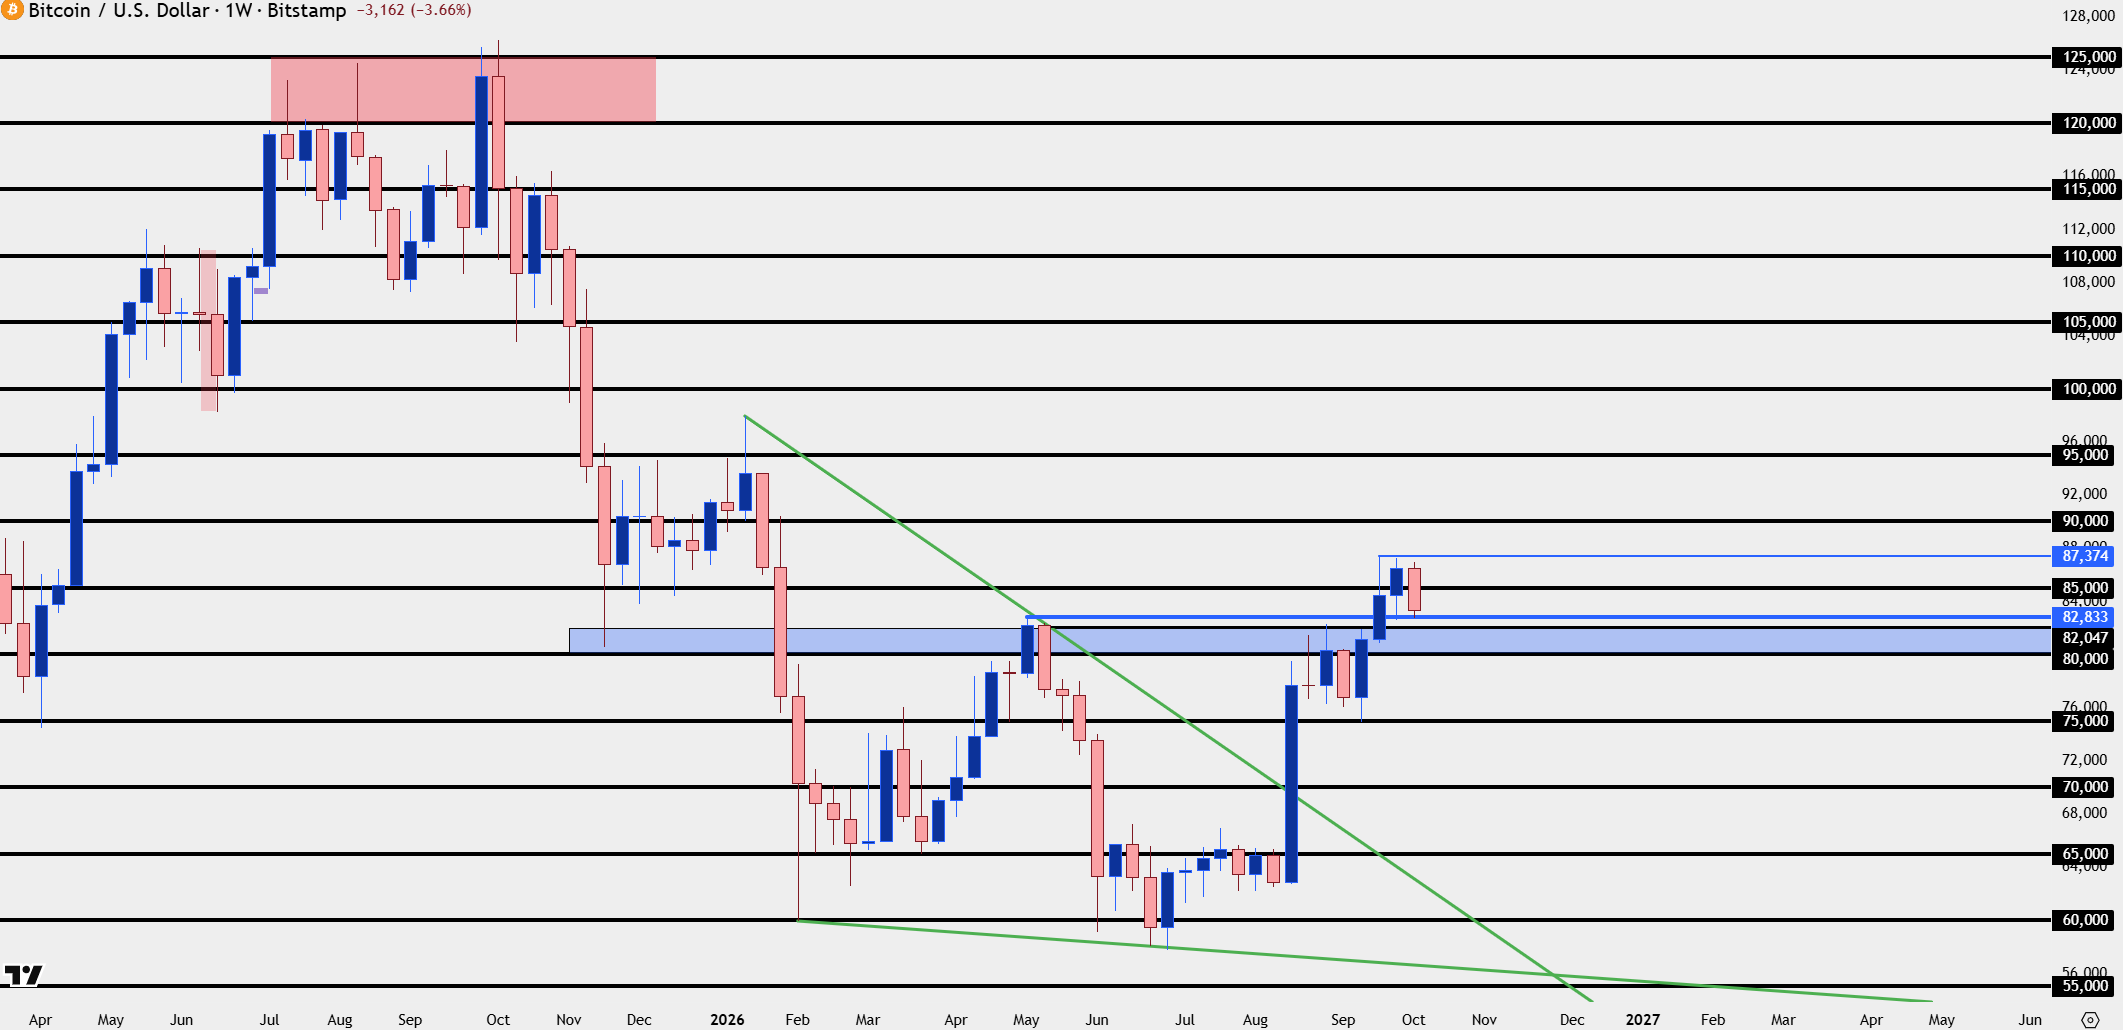
Chart prepared by James Stanley; data derived from Tradingview
Bitcoin Structure
What made the prior support test last week so important is how buyers responded to it – posing a series of higher-lows as the level was defended. I’ve added a green trendline to illustrate that.
For the more recent test, it’s still early and from the four-hour below, we have just one test of that price at 82,833. But – given the recent range the door is open for continuation. And if there is a break of support, deeper support potential exists at the 82,047 or the 80k handle just below that. If 80k is lost, then 75k becomes the big marker as that held a massive spot back in September, just before the FOMC rate hike.
Losing that opens the door for a steeper slide and that would be seen as a large failure from bulls.
Bitcoin Four-Hour Chart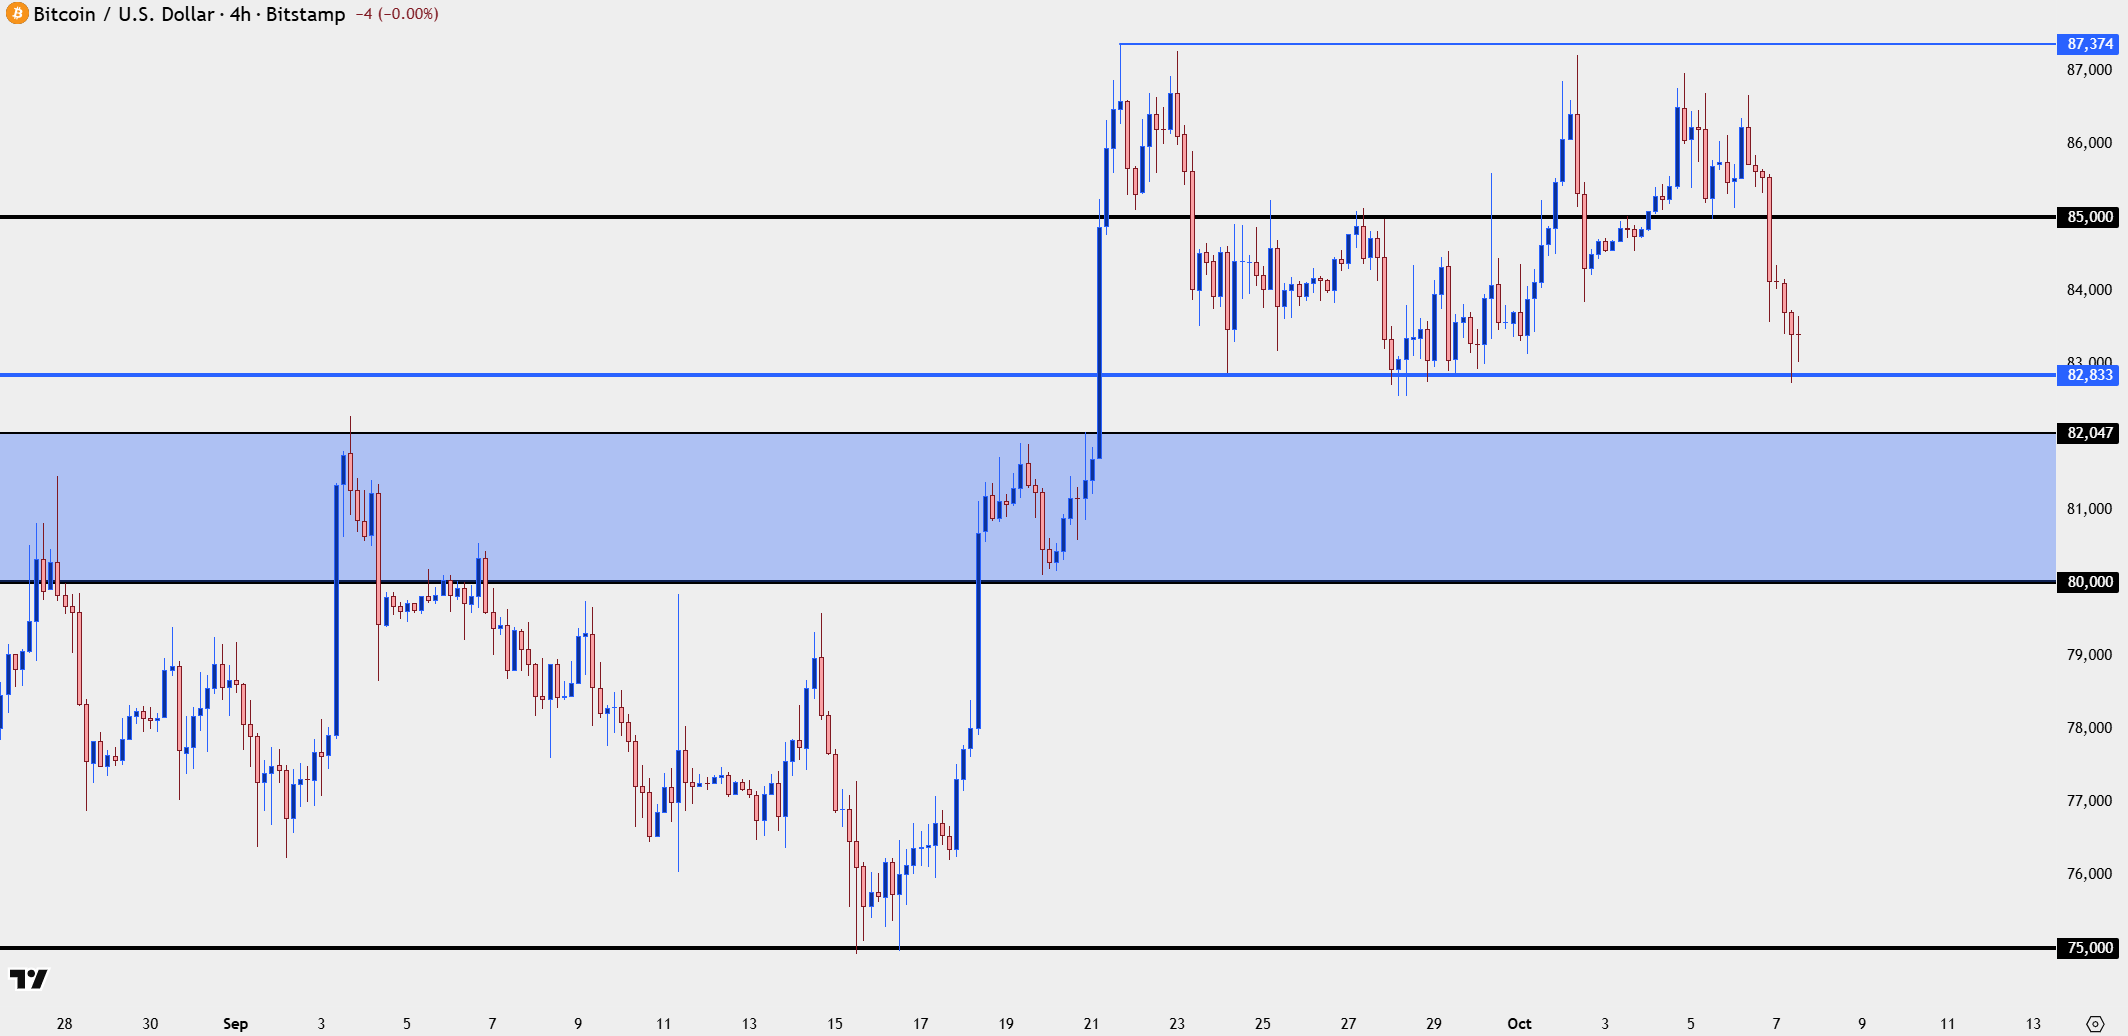
Chart prepared by James Stanley; data derived from Tradingview
--- written by James Stanley, Senior Market Analyst, Global Macro
Related tags:
Latest market news











Web Trader platform
Our sophisticated web-based platform is packed with features.
Open an account today
Experience award-winning platforms with fast and secure execution.
Economic calendar
Related articles

Bitcoin Forecast: BTC/USD Back to $80K Ahead of Warsh’s Jackson Hole Speech
After surging over $15,000 in the past 10 days alone, there is risk of a near-term pullback if Warsh says anything remotely hawkish at Jackson Hole - what are the levels to watch from here?


S&P 500 Forecast for the Week Ahead: Fresh SPX ATHs Despite Growing Bubble Fears
Is it a bubble or just a mania? While AI holds a lot of promise the valuations are becoming untethered from historical norms but that doesn’t necessarily mean that prices need to come down.

Bitcoin, Gold Price Outlook: US CPI & Overbought Risks in Focus
Bitcoin, Gold Price Outlook Following a steep risk-on rally across US equity indices and precious metals, several major markets are approaching critical technical levels as momentum becomes increasingly stretched.
