


Dow Jones Forecast: Caution Persists Ahead of the Fed Minutes
Recent trading sessions have begun to highlight a clear lack of direction around Dow Jones price action. This can be seen in the performance of the last three sessions, where the index has posted a modest decline of approximately 0.2%, reflecting the absence of a consistent directional bias and a growing sense of caution across the market.
Written by
Julian Pineda
Market Analyst
Recent trading sessions have begun to highlight a clear lack of direction around Dow Jones price action. This can be seen in the performance of the last three sessions, where the index has posted a modest decline of approximately 0.2%, reflecting the absence of a consistent directional bias and a growing sense of caution across the market.
For now, this neutral environment appears to be driven by anticipation surrounding the upcoming Federal Reserve minutes, as the central bank's outlook continues to play an important role in shaping risk appetite. At the same time, the Dow remains challenged by a bond market that continues to offer elevated yields. Under these conditions, any signal reinforcing the idea of a more aggressive Fed could continue to favor a phase of indecision or even more pronounced weakness around the index in the coming sessions.
Fed Minutes Day Has Arrived
The Federal Reserve will release the minutes from its latest policy meeting today, providing investors with additional details regarding the decision to raise interest rates by 25 basis points. Markets will also be closely watching to determine how broad the support was among policymakers and which factors members currently consider most important when evaluating monetary policy over the coming months.
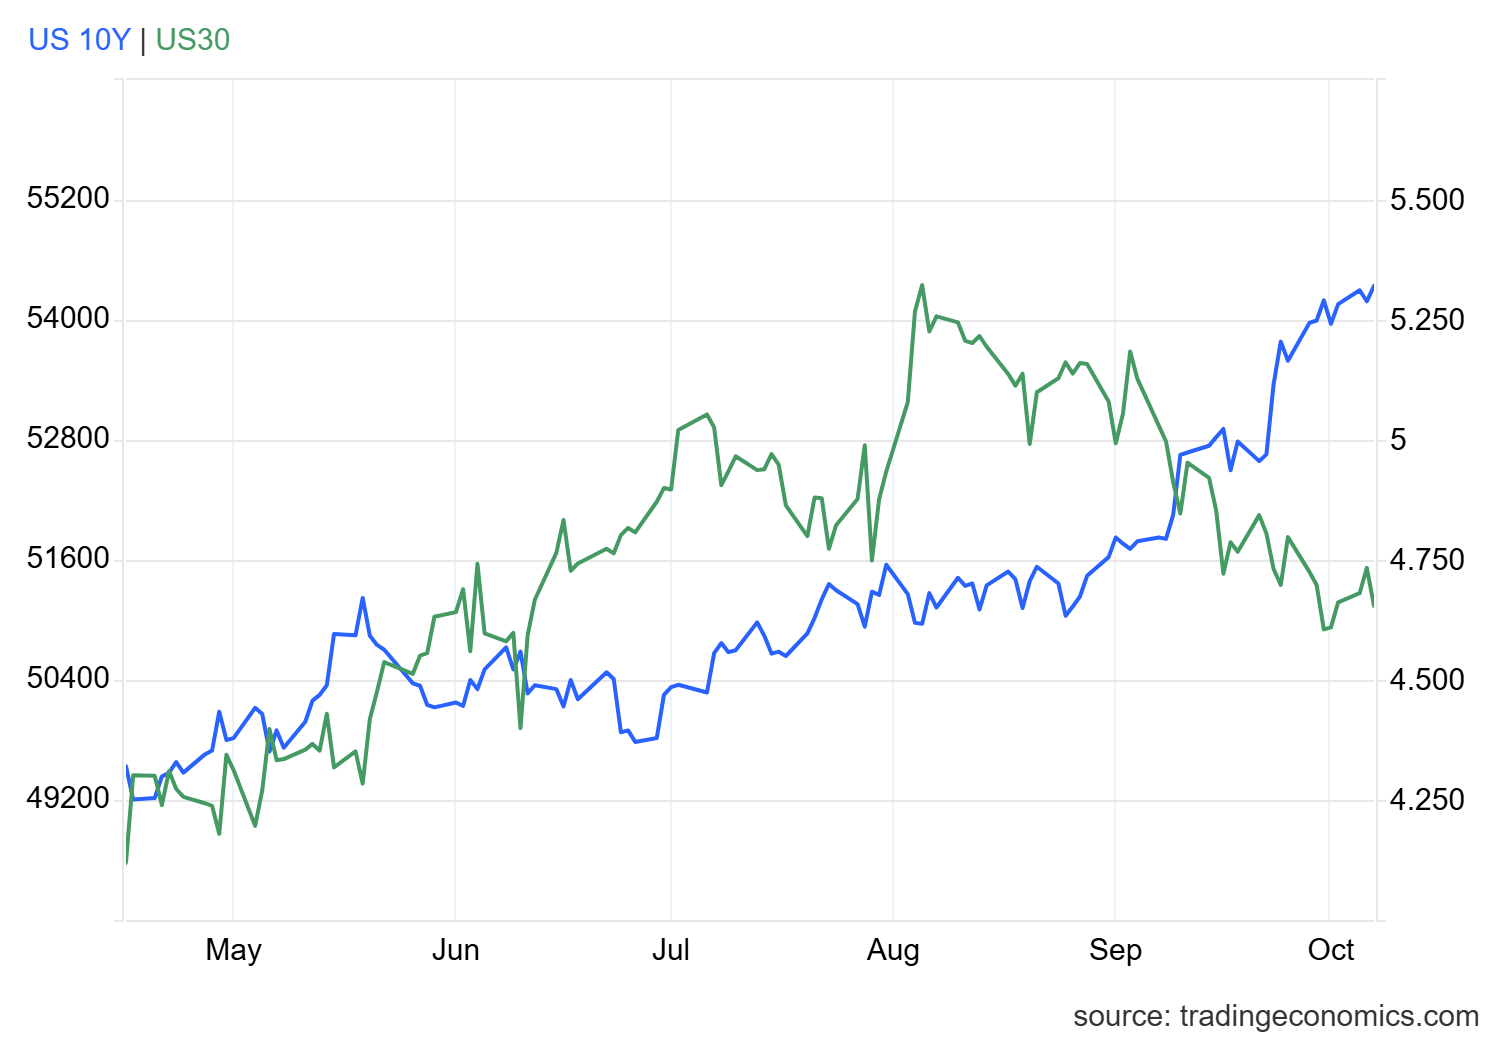
This event carries particular importance because, over recent weeks, expectations of a relatively hawkish Fed have been one of the main drivers supporting the strength of the U.S. bond market. This can be observed in 10-year Treasury yields, which continue to trade above the 5.3% area. These levels remain attractive to investors and could persist if the minutes reinforce a restrictive monetary policy outlook.
The connection with the Dow Jones is also significant. As bond yields have continued to rise, the index has shown a gradual loss of momentum in demand. Unlike technology-heavy indices, the Dow does not benefit as directly from the artificial intelligence growth narrative and therefore tends to be more sensitive to competition from alternative markets such as fixed income. As a result, when the relative appeal of bonds increases, the Dow often faces greater difficulty sustaining a meaningful recovery.
Source: TradingEconomics
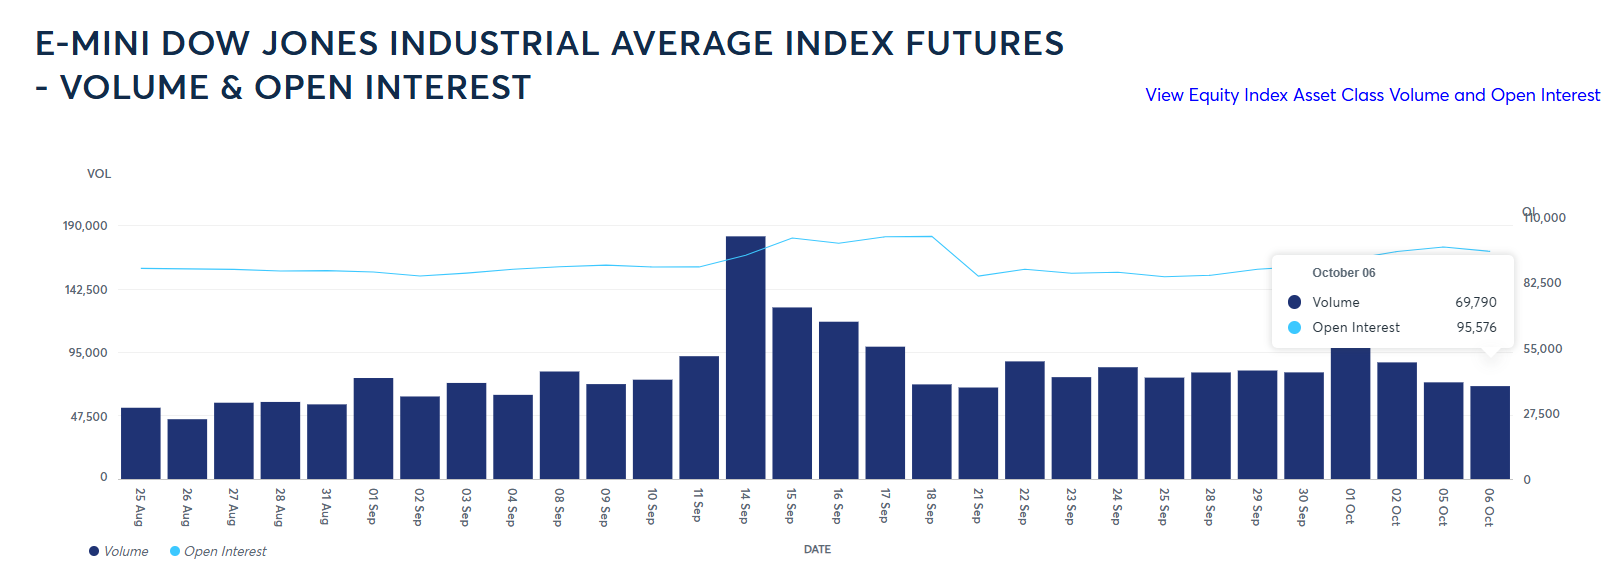
This cautious environment is also becoming evident in market activity. As of the close on October 6, trading volume in the E-mini Dow Jones Industrial Average contract stood at roughly 70,000 contracts, a figure considerably lower than the levels observed in mid-September, when activity approached 200,000 contracts.
This decline in volume reflects two important factors: the growing attractiveness of the bond market and investor caution ahead of additional guidance from the Federal Reserve. As a consequence, activity around the index continues to show a high degree of sensitivity to monetary policy developments.
Source: CMEGROUP
Taking all of this into account, confidence around the Dow Jones appears to remain constrained by a combination of caution ahead of the Fed minutes and a bond market that continues to attract investor interest. Under this scenario, any signal supporting expectations of a more restrictive monetary policy stance could continue favoring a period of indecision or even a more relevant wave of selling pressure in the short term. However, it is also important to consider the opposite outcome, as any signs of a more flexible Fed could begin to support a recovery in demand around the index during the sessions ahead.
Dow Jones Technical Forecast
Source: StoneX, Tradingview
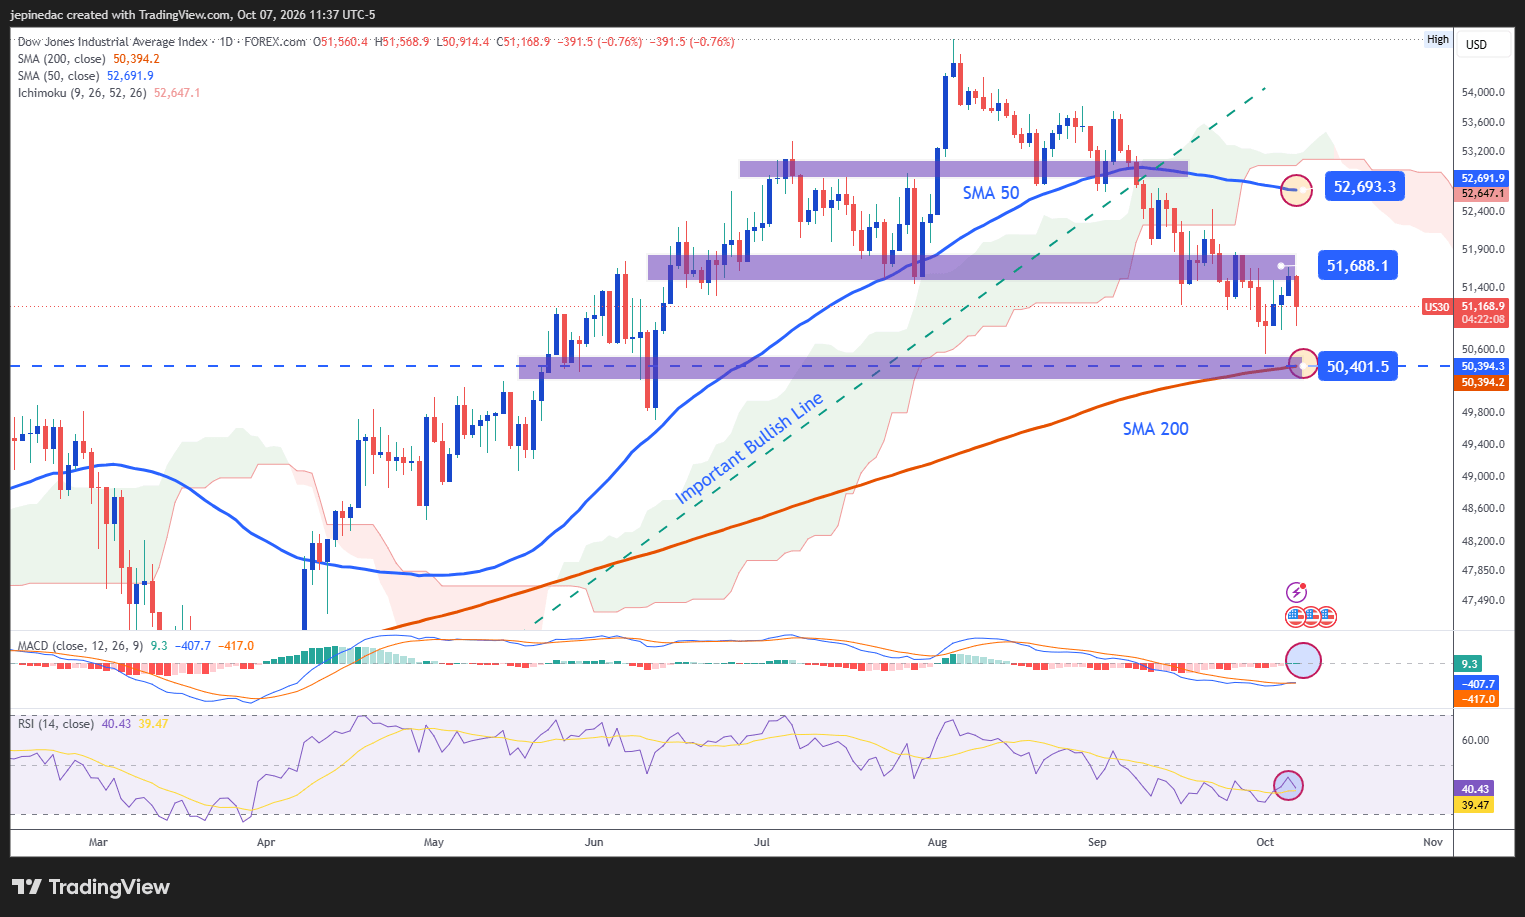
- Neutrality becomes increasingly evident: Several sessions have now passed since the Dow Jones broke below the bullish trendline that had served as the chart's most important technical reference in recent months. However, rather than giving way to a dominant bearish trend, the market has gradually transitioned into a more neutral environment. As long as the selling pressure accumulated in recent weeks fails to break key support levels on the daily chart, this dynamic could begin to favor the formation of a more established trading range over the coming weeks.
- RSI: The RSI continues to fluctuate very close to the 50 level, which represents the indicator's neutral zone. This reading reflects a relatively balanced dynamic between buyers and sellers and supports the idea that a phase of indecision may continue to dominate market conditions in the near term.
- MACD: A similar picture can be observed in the MACD, whose histogram remains very close to the 0 neutral line. This behavior reflects that short-term moving-average momentum remains in equilibrium, reinforcing the possibility that the current lack of direction may continue to be an important feature of Dow Jones price action in the sessions ahead.
Key Levels:
- 52,700 Points – Key Resistance: This represents the most important upside barrier to monitor in the short term. The level coincides with the 50-period simple moving average and the Ichimoku Cloud resistance area. Price action returning to this level could begin to restore relevance to the bullish bias and revive the upward structure that dominated previous weeks.
- 51,700 Points – Near-Term Barrier: An important equilibrium area that aligns with retracement levels observed during previous weeks. As long as the index continues to trade near this reference, a neutral environment could remain dominant and potentially support the development of a short-term trading range.
- 50,400 Points – Key Support: A major support zone that coincides with important lows observed months ago and the 200-period simple moving average. A sustained move below this level could significantly alter the current chart structure and open the door to a more established bearish trend in the weeks ahead.
Written by Julian Pineda, CFA, CMT – Market Analyst
Follow him on: @julianpineda25
Latest market news











Web Trader platform
Our sophisticated web-based platform is packed with features.
Open an account today
Experience award-winning platforms with fast and secure execution.
Economic calendar
Related articles

Gold and S&P 500 analysis: What now after Warsh’s hawkish speech?
The dollar surged across the board after the Fed Chair Kevin Warsh surprised with a hawkish-leaning speech at the Jackson Hole summit. All the bearish dollar bets that had been accumulated since last Friday on the back of data weakness and bond market troubles had to be squared and that triggered a short squeeze rally for the dollar. Gold and silver dropped, as a result, as too did bitcoin, while US indices were giving back earlier gains.


DAX and EUR/USD forecast: Lower energy prices, yields offer support
But the question, of course, is how much further oil prices and bond yields can fall. For now, the combination is supportive of risk assets and is helping to sustain a relatively benign decline in the dollar. The focus today will be on US core PCE inflation, due for release shortly, while Nvidia’s second-quarter earnings will provide another test for risk appetite after the US markets close – not just for US indices but for global tech-heavy indices given the influence Nvidia has over the global tech and AI names.

AUD/USD slips as DXY ignores the playbook
The US dollar moved against its recent macro playbook on Monday. AUD/USD paid the price, although bulls still hold the upper hand.
