

Bitcoin Backs Down from $65k As Gold Breakout Takes Over
As we came into August it looked as though there may have been a changing of the guard, with Bitcoin breakout out and Gold holding near $4k. That course has shifted and BTC/USD continues to consolidate.
Written by
James Stanley
Sr. Strategist
Bitcoin Talking points:
- BTC/USD broke out three weeks ago but once again, life above $65k was short-lived.
- That price was resistance for five consecutive days until today, where sellers took on more of a role to push price down to a fresh low. This begs the question as to whether bears can push down for a test of next support at $62.5k.
At this point the breakout in Bitcoin has failed and this dashes hopes of a changing of the guard for the world’s favored anti-fiat.
While Bitcoin was lauded as ‘digital gold’ a year ago, the $125k level proved to be too hard for buyers and the profit taking that brought out drove a retracement that currently stands at around 50% from that prior all-time-high.
Of course, gold had its own issues earlier this year after topping just below the $5600 level but given that the high in gold was about three months after the high in Bitcoin, the ‘digital gold’ idea was very much on its back foot when that sell-off began. After BTC flirted with a re-test of the $100k level in January, that’s when disaster hit for both gold and Bitcoin longs and it only took a few weeks for BTC/USD to set up on the $65k level, which was support for five consecutive weeks from February through March.
BTC/USD Weekly Chart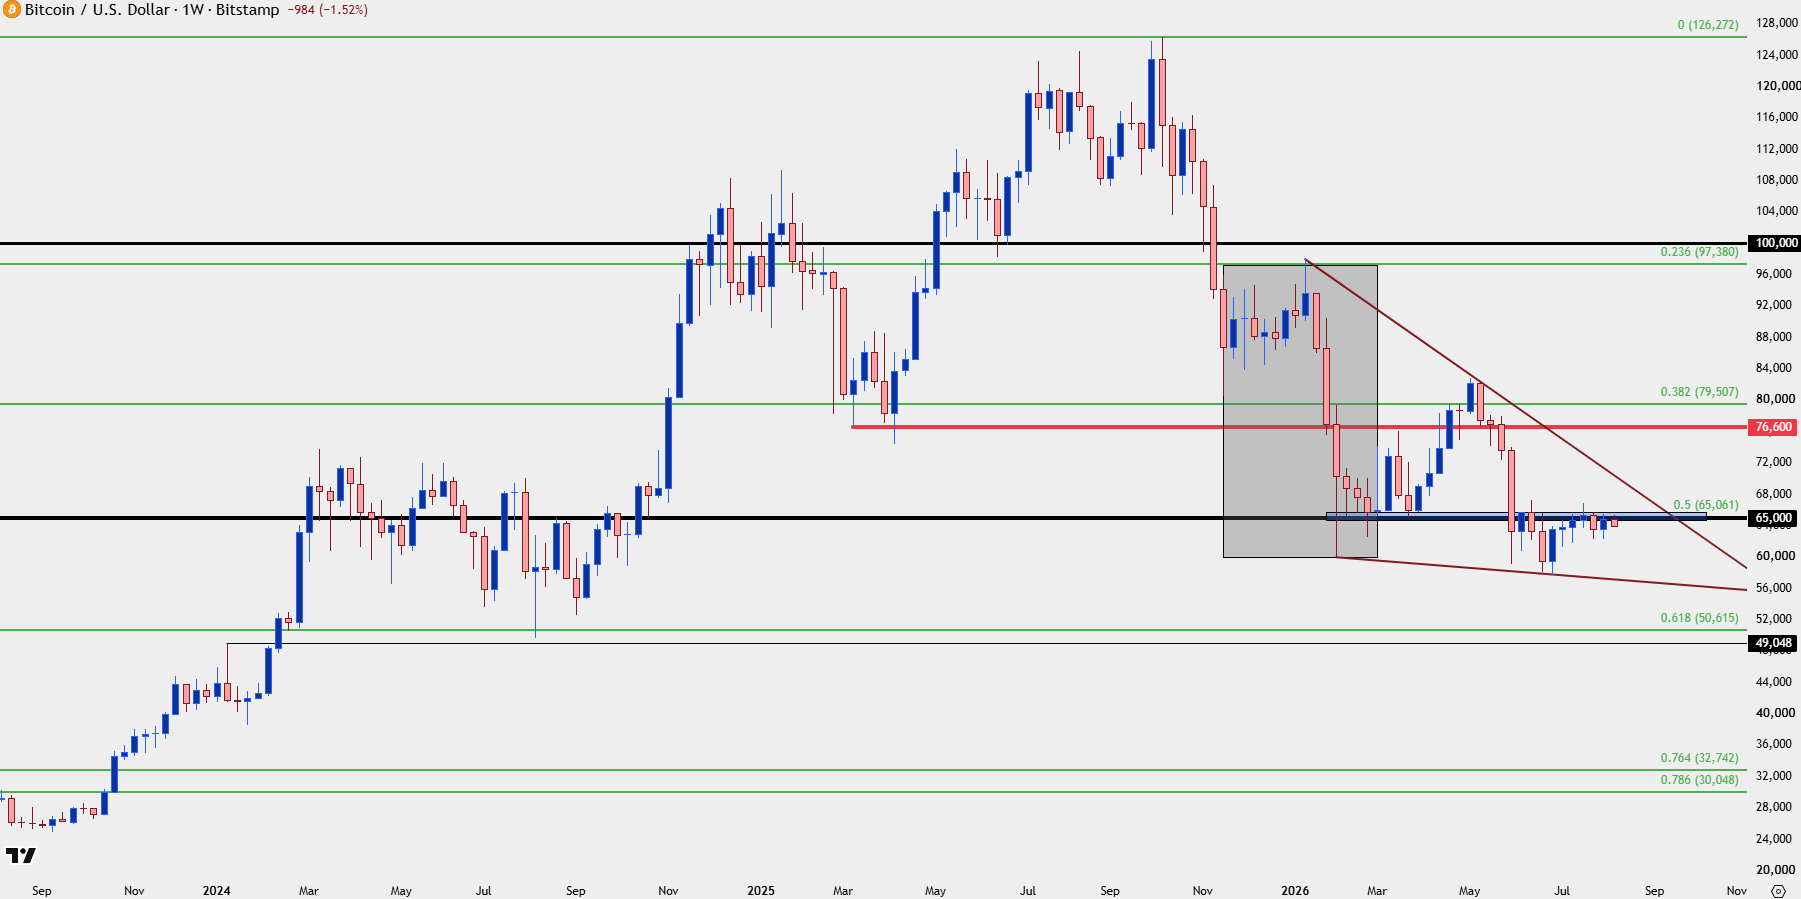
Chart prepared by James Stanley; data derived from Tradingview
Bitcoin’s Next Test
With the $65k failure, the question now is whether buyers come in to defend the lows and most recently, it was a batch of support that had built right around the $62,500 area on eh chart. There were approximately four days of support around that price until buyers lifted into $65k, so, if bullish, then ideally bulls would come in to offer some element of higher-low defense.
If they fail, the next spot down is around $61,500, which held a batch of higher-lows before the initial re-test of the $65k resistance level.
If that fails to hold, then it’s the $60k level that shows prominently and, so far, there’s been lacking momentum from bears beyond that level, as the post-Fed sell-off drove a break and a test below the big figure but bears were seemingly disinterested in follow-through.
Interestingly, that’s around the time of the $4k test in gold but the response to support in Bitcoin seemed faster, and more aggressive than what showed in gold which ultimately took about a month before buyers were able to force the breakout.
BTC/USD Daily Chart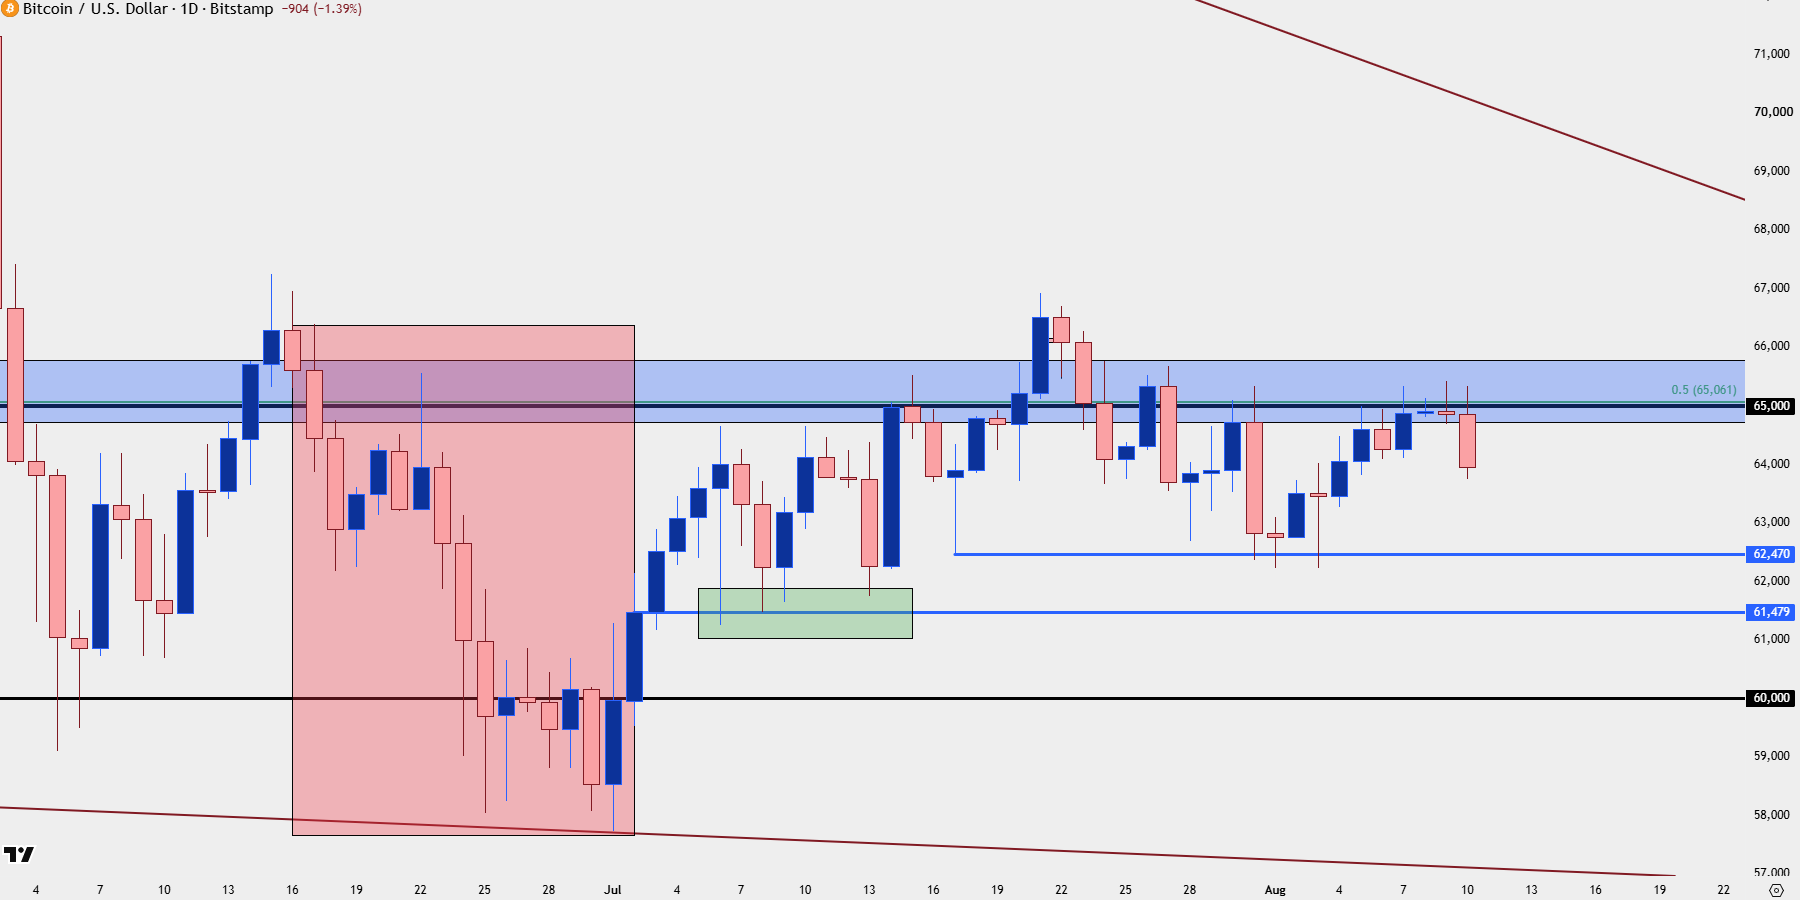
Chart prepared by James Stanley; data derived from Tradingview
--- written by James Stanley, Senior Market Analyst, Global Macro
Related tags:







Web Trader platform
Our sophisticated web-based platform is packed with features.
Open an account today
Experience award-winning platforms with fast and secure execution.
Economic calendar
Related articles

Bitcoin’s failed breakouts are becoming hard to ignore
Three failed breakout attempts and fading momentum have put Bitcoin bulls on notice. Another rejection could open the door lower just as attention swings back towards NVIDIA and the AI trade.


US Dollar, Gold & Bitcoin Weekly Technical Outlook 8 24 2026
Key levels on active technical setups in DXY, Gold, and Bitcoin heading into the start of the week.


Bitcoin takes the baton as BTC/USD breaks higher
Bitcoin is heating up again, with BTC/USD breaking higher as momentum fades across the AI and semiconductor space.