


Gold’s $4k Test Ongoing Despite Monetary Mayhem Elsewhere
Gold has been downright calm of late, at least on a relative basis, and the question now is whether the tide will turn for bulls following more than a month of support tests at the vaulted $4k level.
Written by
James Stanley
Sr. Strategist
Gold Talking Points:
- Gold has tested $4k for five of the past six weeks and sellers have yet to hold a weekly close below the big figure.
- The past two weeks have shown higher-lows, illustrating a degree of defense at that price.
- I looked into the matter in greater depth in a video for StoneX TV, linked below.
This content was created by an affiliate of FOREX.com and represents the views and opinions of the author/speakers, not the views and opinions of Forex.com, StoneX Group Inc., or its subsidiaries. The content has not been independently reviewed by FOREX.com.
Gold came into the year with a full head of steam, but 2026 certainly hasn’t gone that way for bulls as the past six months have seen sellers taking a strong swing at the matter.
Of late, however, the bigger item has been slowing volatility as gold price action has compressed, with the $4k level coming in to hold the lows. This was a price that bears shied away from on the initial portion of the pullback in March. And then again in early-June. What ultimately drove gold down for a $4k test as the FOMC rate decision on June 17th but, so far, bulls have come in for a strong defense of that level.
From the weekly chart below, we can see where five of the past six weeks have wicks testing that level. This shows that while price may have dipped below during the week, buyers showed up, thereby exposing underside wicks on the weekly chart.
And for the past two weeks, buyers have shown greater anticipation by jumping in at higher-lows, alluding to the possibility that sellers are giving way to greater buying pressure and bulls are ramping up their appetite on the long side of gold.
Gold Weekly Chart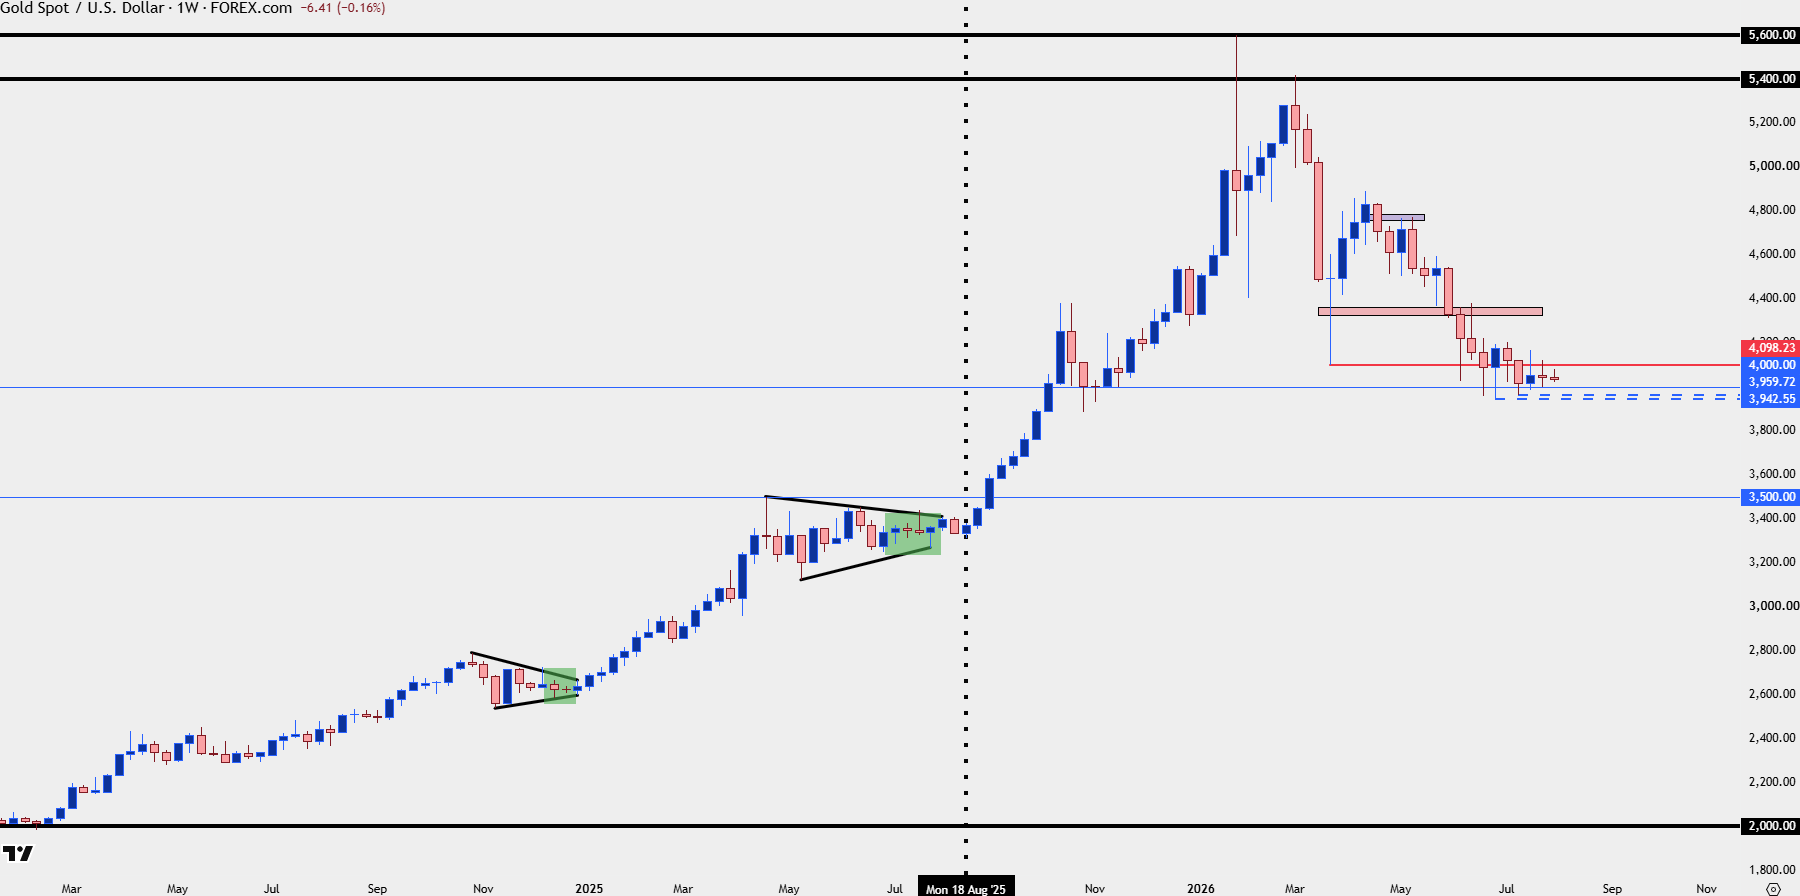
Chart prepared by James Stanley; data derived from Tradingview
Gold Turn Potential
A slowing sell-off can lead to a bullish reversal, but it’s still too early to say that definitively. As traders, instead, the best that we can do is place a line in the sand and then implement an if-then statement, and if buyers do press up to a fresh higher-high, combined with the higher-lows shown in the above chart, we can get more evidence that a turning of the tides may continue ahead.
The levels that I’m tracking for this are at $4100 and $4200, both of which provided some form of resistance over the past month. If we see buyers make a push above that latter price, then we can move forward with the idea that buyers are showing a greater degree of control over the trend, and thus, may be on the cusp of resuming the broader bullish trend.
Gold Daily Chart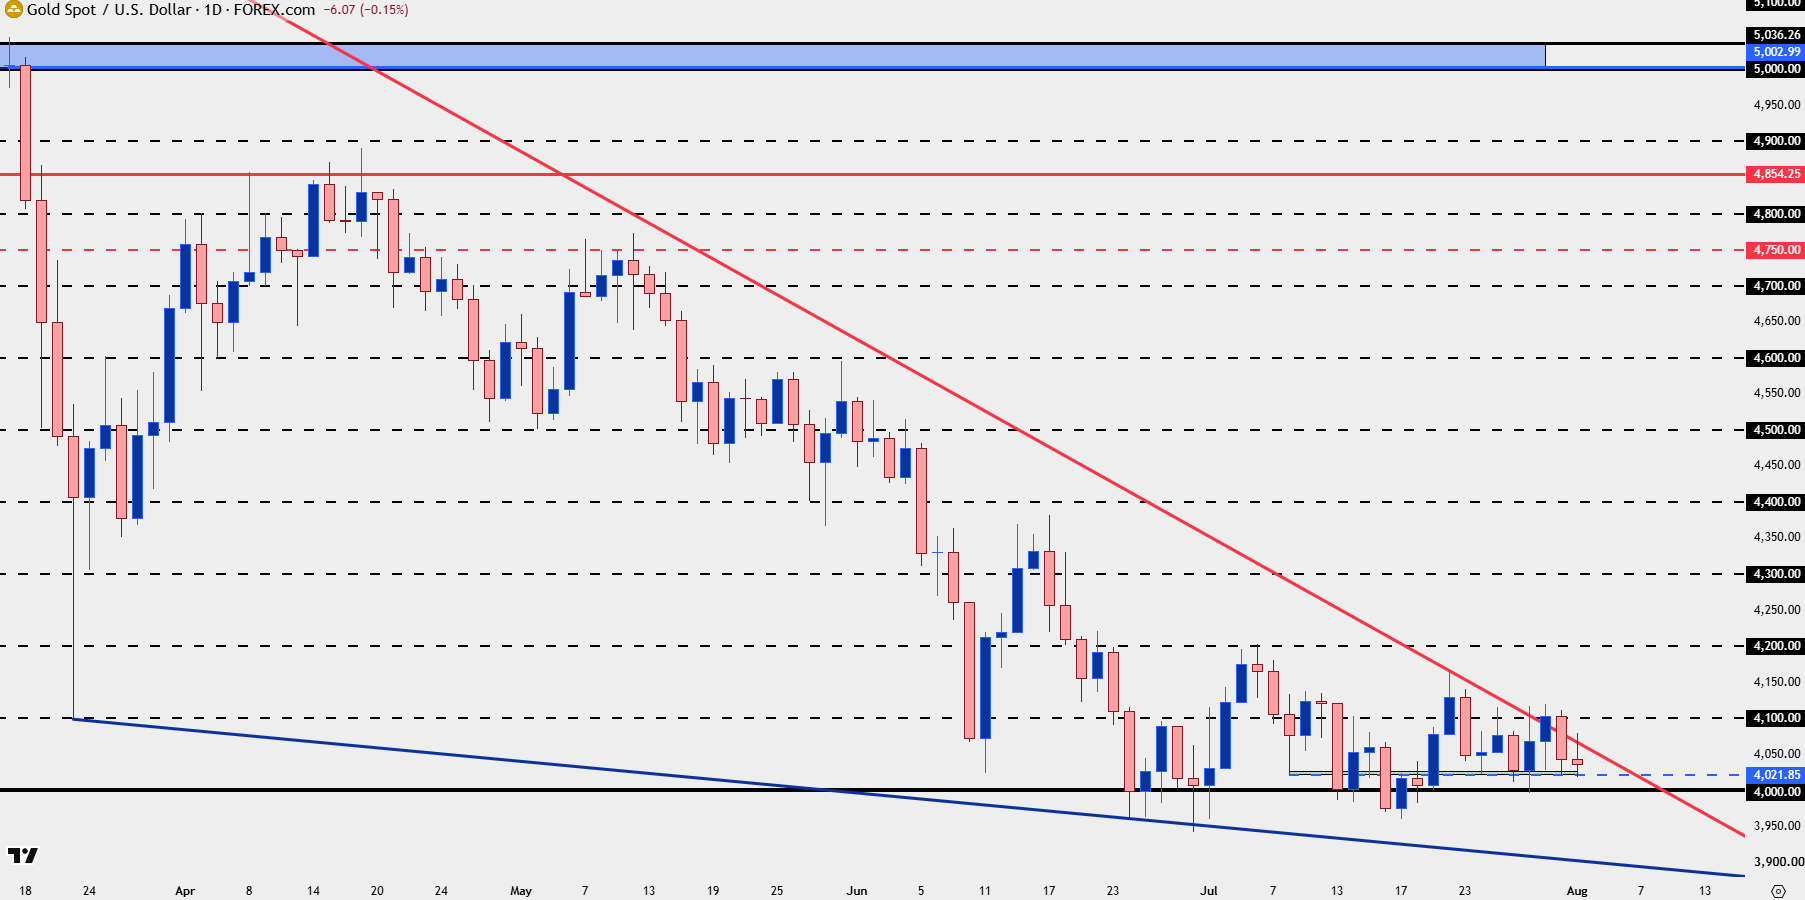
Chart prepared by James Stanley; data derived from Tradingview
--- written by James Stanley, Senior Market Analyst, Global Macro
Related tags:
Latest market news










Web Trader platform
Our sophisticated web-based platform is packed with features.
Open an account today
Experience award-winning platforms with fast and secure execution.
Economic calendar
Related articles

Gold and S&P 500 analysis: What now after Warsh’s hawkish speech?
The dollar surged across the board after the Fed Chair Kevin Warsh surprised with a hawkish-leaning speech at the Jackson Hole summit. All the bearish dollar bets that had been accumulated since last Friday on the back of data weakness and bond market troubles had to be squared and that triggered a short squeeze rally for the dollar. Gold and silver dropped, as a result, as too did bitcoin, while US indices were giving back earlier gains.


Gold Falters at Resistance, Grappling With PCE, Month-End Flows and Jackson Hole
Gold has pulled back from resistance after sticky PCE data, with month-end flows and Jackson Hole now shaping the near-term outlook.


Gold forecast: XAU/USD retreats along with dollar debasement trade
Gold was down nearly 1.5% on the session, with US indices and Bitcoin also struggling. Is this a mere pause before more gains are seen, or have we already seen the end of the recent bullish advance?