


Bitcoin Forecast Demand Activity Shows Signs of Moderation
As the trading week continues, one of the themes becoming increasingly visible in Bitcoin's price action is a growing sense of neutrality. Over the last four trading sessions, the volatility that was evident weeks ago has declined significantly, with average price fluctuations now hovering around 1.00%, a considerably smaller move compared to the 5.00% daily swings seen recently.
Written by
Julian Pineda
Market Analyst
As the trading week continues, one of the themes becoming increasingly visible in Bitcoin's price action is a growing sense of neutrality. Over the last four trading sessions, the volatility that was evident weeks ago has declined significantly, with average price fluctuations now hovering around 1.00%, a considerably smaller move compared to the 5.00% daily swings seen recently. For now, this slowdown reflects a loss of momentum within the market and suggests that demand is no longer displaying the same level of aggressiveness observed in previous weeks, a dynamic that could eventually lead to a more pronounced period of indecision in the sessions ahead.
Factors Limiting Demand for Bitcoin
Over recent trading sessions, several factors have emerged that may be affecting confidence across risk markets. First, a new series of U.S. strikes against Iranian targets has reduced expectations of a meaningful diplomatic resolution in the short term and has once again increased uncertainty surrounding potential inflationary pressures.
This environment is also being reinforced by the Federal Reserve's current stance. Market expectations have shifted following a series of inflation reports that continue to show limited progress in reducing price pressures, while tensions in the Middle East could also keep energy-related inflation risks elevated. As a result, the CME Group probability matrix now reflects a probability above 68% that interest rates could rise toward the 4.00% area at the next policy meeting scheduled for September 16.
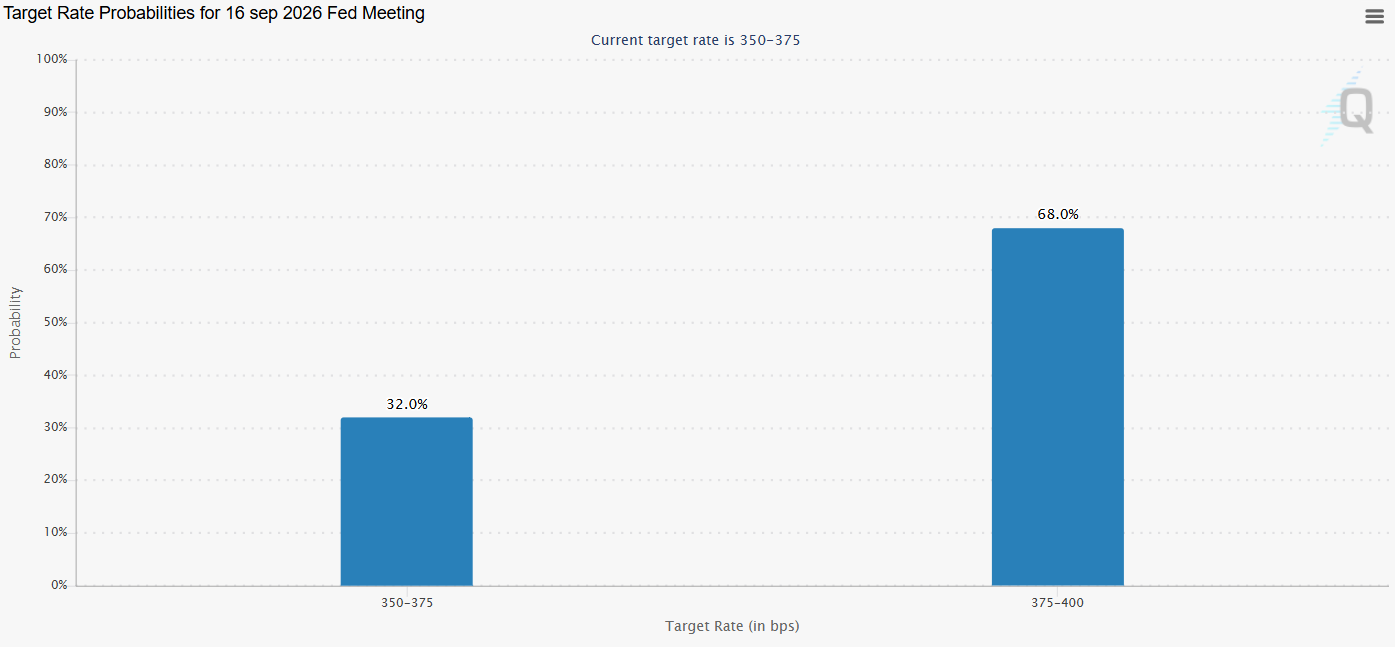
Source: CMEGROUP
This situation has also begun to affect several markets that compete with Bitcoin for investor capital. One of the most important is the U.S. dollar. The combination of a potentially more aggressive Federal Reserve and persistent inflationary pressures could continue favoring dollar-denominated investments as a relatively more stable alternative compared to risk assets.
This environment could affect Bitcoin for two main reasons. First, higher interest rates tend to increase financing costs and reduce part of the liquidity typically available for risk-oriented assets. Second, this outlook also strengthens the relative appeal of alternative markets such as the U.S. dollar. In fact, the DXY Index, which measures the strength of the U.S. currency, is once again approaching the 100-point area and has been showing a gradual recovery in demand over recent sessions.
Another important factor is that all of these developments are coinciding with a decline in activity across the Bitcoin market itself. This can be observed through the behavior of Open Interest, which continues to show a downward trend and is once again approaching the $25 billion area. Since this indicator measures the total number of open positions across the market, a decline generally reflects a gradual reduction in market participation.
When this trend is combined with the recent decline in BTC prices, it becomes possible that a meaningful portion of these exits corresponds to long positions being closed. This suggests a moderation in demand activity that coincides with the fundamental developments observed in recent days.
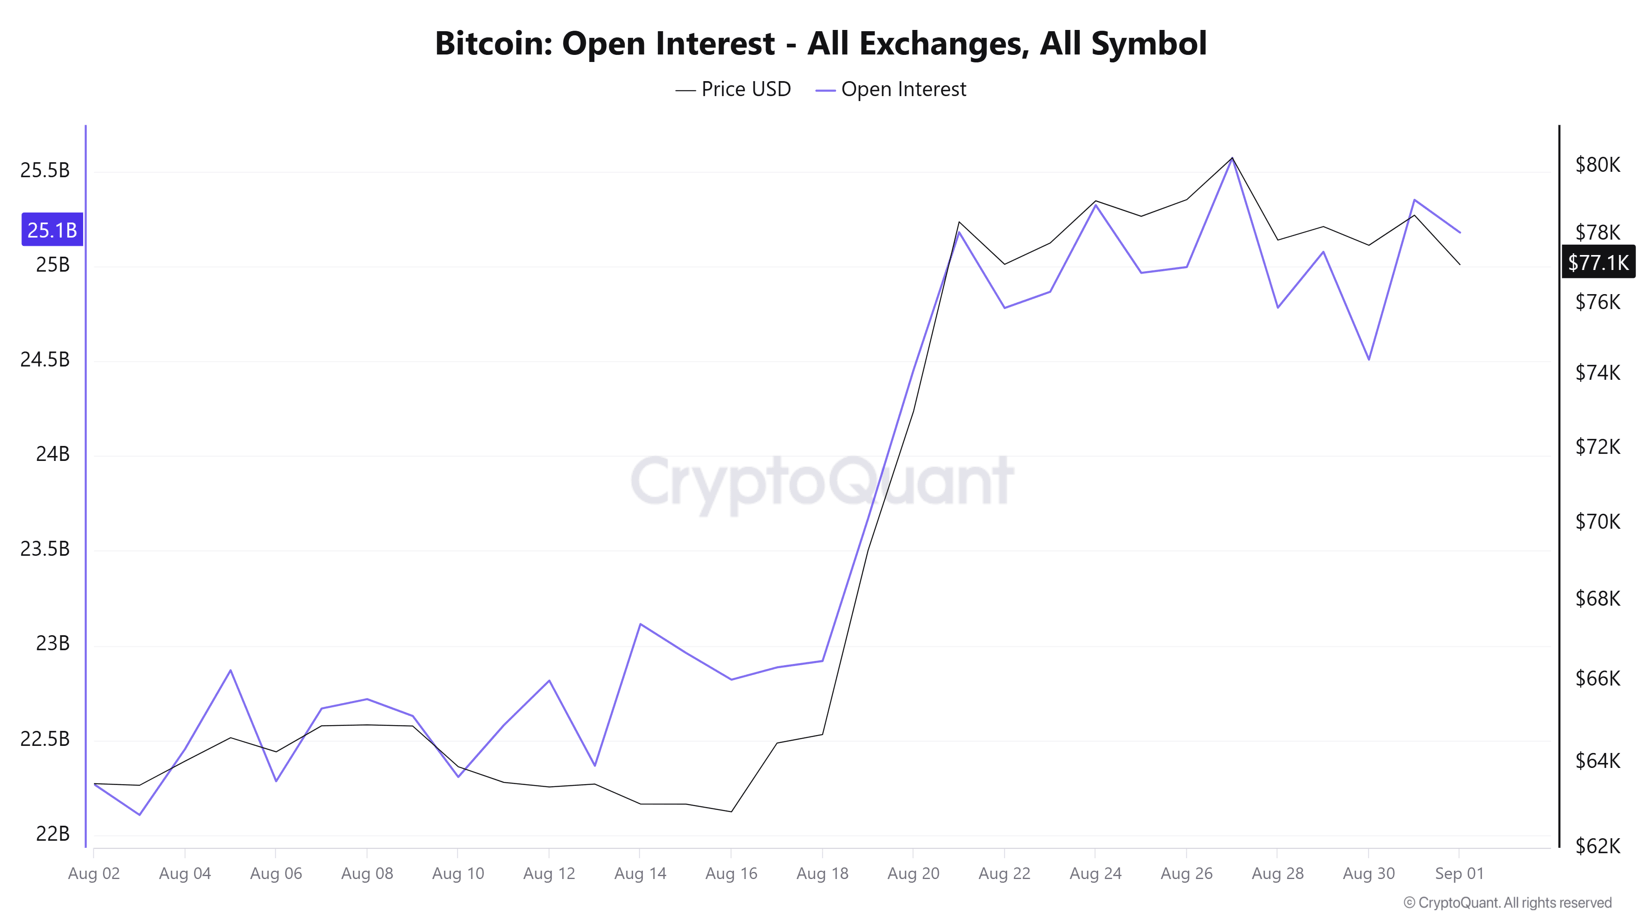
Source: Cryptoquant
Taking all of this into account, it appears that factors such as rising geopolitical risks, the possibility of a more aggressive Federal Reserve, and the recovery of alternative markets like the U.S. dollar are beginning to affect activity around Bitcoin. Several indicators are already reflecting lower market participation in response to these developments. As long as this environment remains in place, BTC could continue facing a more balanced trading environment, with the lack of direction remaining an important feature of the market in the sessions ahead.
Bitcoin Technical Outlook
Source: StoneX, Tradingview
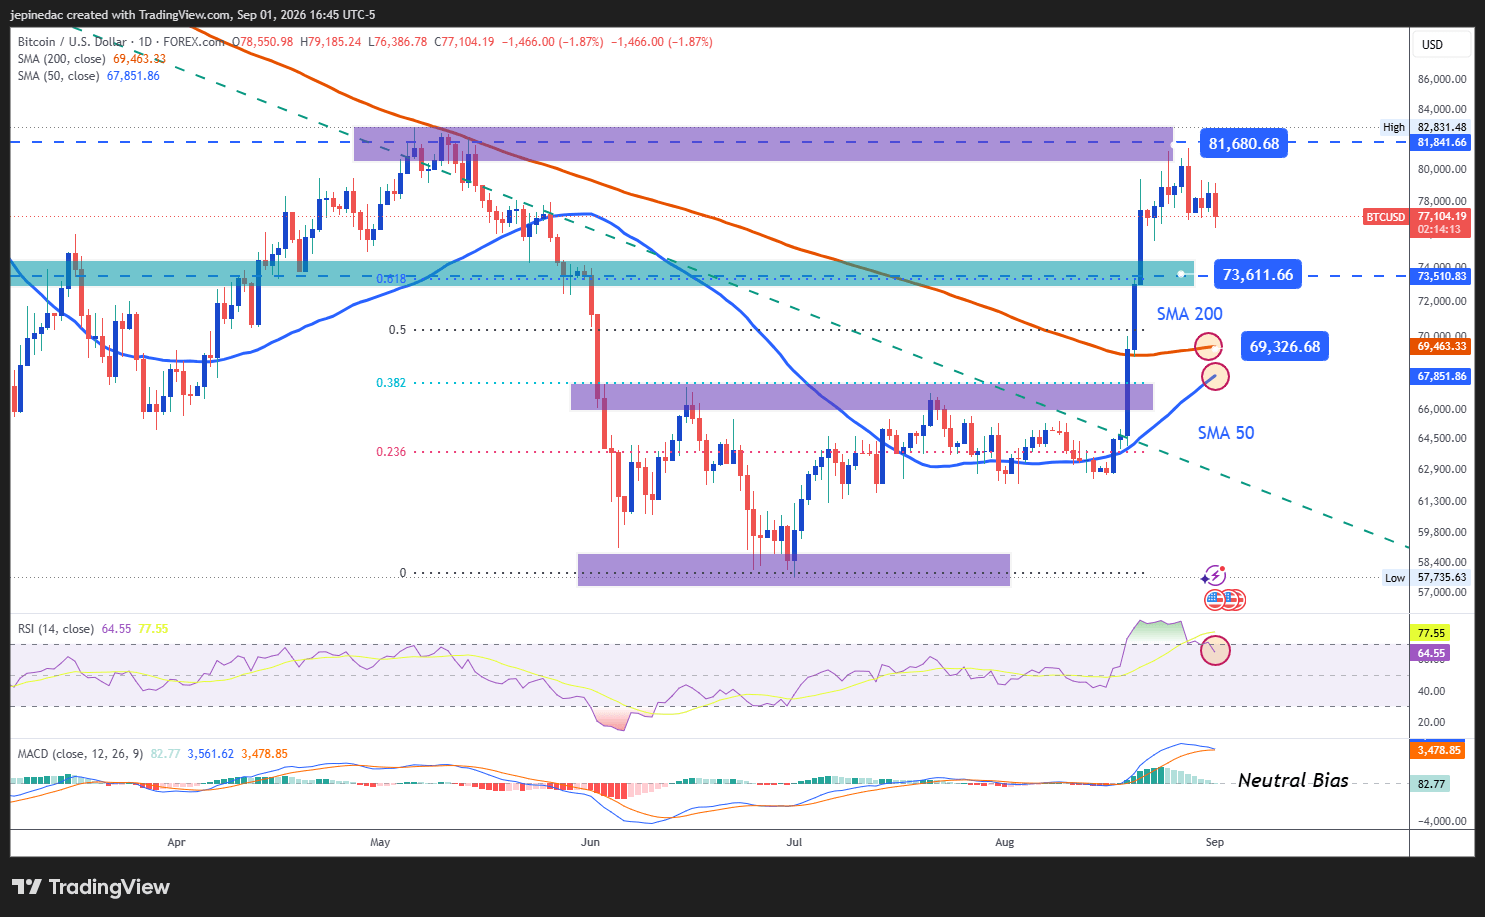
- Lack of Direction Begins to Emerge: Despite the strong recovery Bitcoin experienced in previous weeks, recent sessions have started to reflect a more noticeable balance between buyers and sellers. This situation is not only preventing the daily chart from developing a clearer bullish structure, but could also be creating room for a more established consolidation phase. Unless major price breakouts occur, a broader trading range could begin to gain relevance during the coming sessions.
- MACD: The MACD histogram continues to fluctuate around the neutral 0 level, suggesting that the average strength of short-term moving averages remains relatively balanced. This reading supports the possibility that the market may continue developing a consolidation pattern over the next several sessions.
- RSI: The RSI presents a slightly different picture, as the indicator remains above the neutral 50 level. However, the downward slope recently observed suggests that the buying momentum seen in previous weeks has begun to slow. This behavior could reflect a gradual reduction in bullish pressure and reinforce the importance of a broader period of indecision within the market.
Key Levels:
- 81,700 USD – Major Resistance: This level represents the nearest significant high and stands as the main bullish barrier above the psychological $80,000 area. Unless price manages to establish itself above this zone, it may prove difficult to recover stronger buying momentum, allowing the current consolidation phase to remain relevant.
- 73,600 USD – Nearby Barrier: This area coincides with recent price retracements and the 61.8% Fibonacci retracement of the most important move on the chart. It could become the key technical reference should downside corrections continue to develop over the coming sessions.
- 69,300 USD – Key Support: This level coincides with the 200-period Simple Moving Average and remains one of the most important downside barriers within the current structure. Price action returning toward this area could begin to weaken confidence in the recent recovery and potentially open the door to a more dominant bearish bias over the coming weeks.
Written by Julian Pineda, CFA, CMT – Market Analyst
Follow him on: @julianpineda25
Related tags:
Latest market news









Web Trader platform
Our sophisticated web-based platform is packed with features.
Open an account today
Experience award-winning platforms with fast and secure execution.
Economic calendar
Related articles

Bitcoin Forecast: BTC/USD Back to $80K Ahead of Warsh’s Jackson Hole Speech
After surging over $15,000 in the past 10 days alone, there is risk of a near-term pullback if Warsh says anything remotely hawkish at Jackson Hole - what are the levels to watch from here?


Bitcoin’s failed breakouts are becoming hard to ignore
Three failed breakout attempts and fading momentum have put Bitcoin bulls on notice. Another rejection could open the door lower just as attention swings back towards NVIDIA and the AI trade.


US Dollar, Gold & Bitcoin Weekly Technical Outlook 8 24 2026
Key levels on active technical setups in DXY, Gold, and Bitcoin heading into the start of the week.
