


US Dollar Outlook: DXY Seasonality Meets NFP Volatility
DXY enters September with little directional seasonality but elevated volatility, while NFP and ISM data could test the US dollar rebound.
Written by
Matt Simpson
Market Analyst
September seasonality offers little directional guidance for the US dollar, but volatility has historically been elevated. With ISM services and NFP approaching, DXY traders face another potential volatility event as the index rebounds towards resistance around 100–101.
View related analysis:
DXY Faces September Volatility as NFP Takes Focus
Volatility has typically been lower for the US dollar index during the summer months, with August’s high-to-low range of 1.5% its lowest since November. Though it may not have felt like it, given the final two weeks of the month delivered a two-way whipsaw covering most of August’s range.
And with the ISM services and NFP reports pending, in an environment where traders are hunting for Fed policy clues, there is potential for further volatility ahead — particularly in a month that has historically been the third most volatile of the year, according to seasonality.
Source: CME, LSEG
US Dollar Seasonality Points to a Volatile September
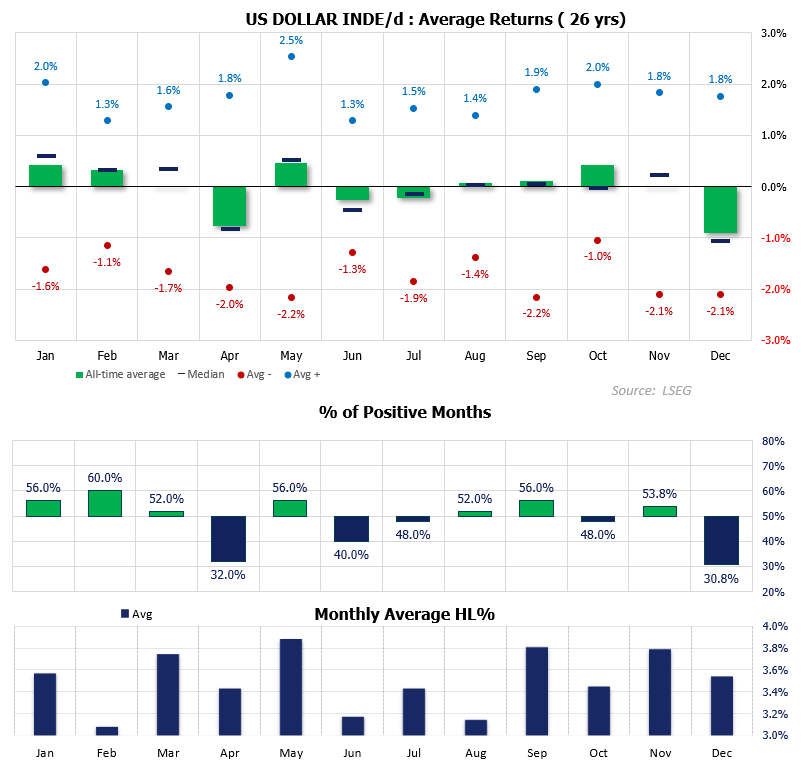
While I could go as far back as 1976, I have used returns from 2000 to capture more recent behaviour this century while still providing a reasonably large sample of 26 years. Directionally, the US dollar leaves few clues as to which way it could trade this month.
Average September returns are minimal at 0.1%, with the median even lower at 0.05%. If that tells us anything, it is that returns have been consistently mixed rather than the average being heavily distorted by a few outliers. The 56% win rate provides a very slight edge to bulls, but it would carry more weight in my book if the actual returns were more impressive.
September Directional Bias Remains Weak
Average positive and negative returns are also relatively balanced at around 2%. Despite the slight advantage for bulls with a 56% win rate, the average up month is only 1.9%, compared with a 2.2% decline for bearish months. That remains too close to coin-toss territory for me to have much confidence in September’s directional bias.
The one pattern worth paying attention to is volatility, with September’s 3.8% average high-to-low range the third highest of the year. And with traders on the edge of their seats for further clues on Fed policy, my guess is this month could deliver another show. But the direction it takes seems very much in the hands of how the incoming data lands.
September Seasonality Takeaways
- September offers little directional edge for the US dollar, with average and median returns of just +0.1% and +0.05%.
- The 56% positive-month rate gives bulls only a slight advantage, and the return profile is still close to coin-toss territory.
- Down months have been slightly larger than up months, averaging -2.2% versus +1.9%.
- Volatility is the clearer seasonal feature, with September’s 3.8% average range ranking as the third highest of the year.
US Dollar NFP Returns Favour Volatility Over Direction
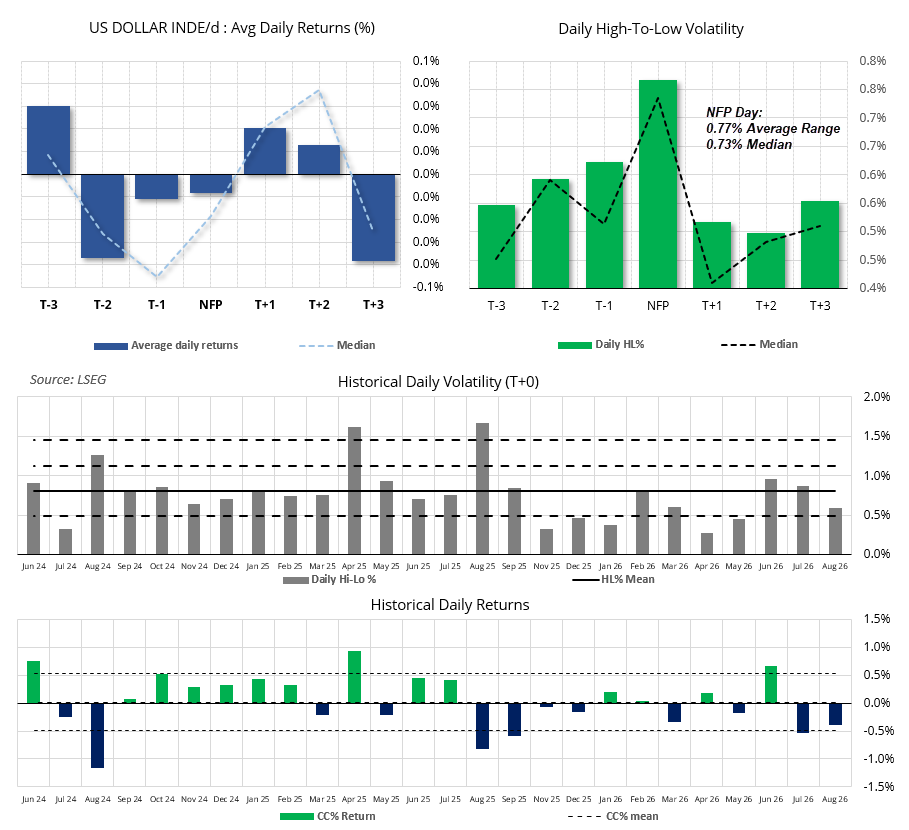
Using data back to 2017, the charts show how the US dollar index has performed over the three days either side of nonfarm payrolls (NFP). Similar to the seasonality analysis, the standout observation comes from volatility rather than direction. NFP itself has produced an average return of just -0.01% and a median of -0.02%, while the dollar has fallen 52.7% of the time — hardly enough to suggest a reliable directional bias.
NFP day generates the highest average daily range of 0.77%, with a median of 0.73%, suggesting the result is fairly consistent over this lookback period. Interestingly, volatility also tends to increase into NFP — whereas I would usually expect it to diminish ahead of the event before expanding sharply on the day itself. The range of historical NFP-day returns, from +1.14% to -1.82%, also highlights just how large individual moves can be despite the near-zero average return.
There are some modest directional tendencies either side of the release. The dollar has fallen 56.4% of the time on T-1, while T+2 has produced the strongest bullish bias at 56.4%. That then flips on T+3, which has been negative 57.3% of the time. None are strong enough for me to consider standalone trading signals, but they provide useful context around the event. Also note that volatility is notably lower from T+1 to T+3, covering the following Monday through Wednesday.

Source: BLS, LSEG
NFP Trading Takeaways
- NFP is more useful as a volatility event than a directional signal, with average DXY returns close to flat on release day.
- NFP day has delivered the highest average daily range at 0.77%, with volatility also tending to build into the release.
- The strongest directional skews sit either side of NFP: T-1 has been negative 56.4% of the time, while T+2 has been positive 56.4%.
- T+3 flips back bearish, with the US dollar falling 57.3% of the time, although none of these probabilities are strong enough to treat as standalone signals.
US Dollar Index (DXY) Technical Analysis
I pointed out ahead of Warsh’s Jackson Hole speech that traders remained defiantly bullish on the US dollar in the CME futures market, despite the decent pullback in DXY. So it is no major surprise to see a solid bounce underway, and it could extend if incoming data supports a second hike after the one already favoured for September.
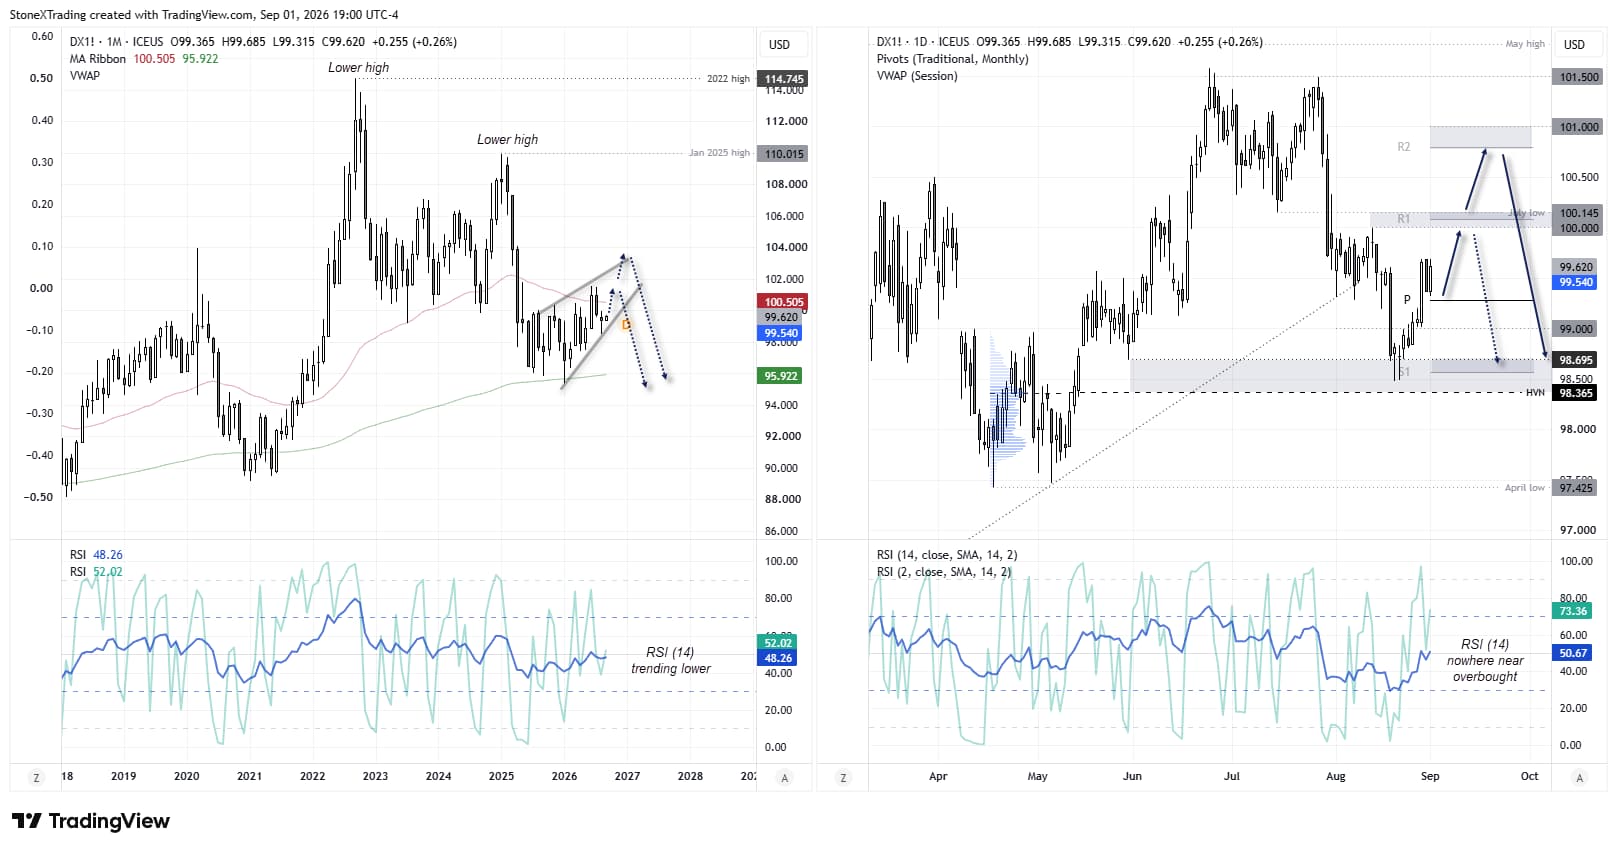
Note the doji on the monthly chart, which hints at a potential swing low and could pave the way for further upside over the near term. For now, I assume we have seen the high for the US dollar index this year, although if the data heats up then perhaps a move towards 102, or slightly higher, is on the cards.
DXY Rebound Faces Resistance Near 100–101
Yet price action on the monthly chart still appears corrective within a rising wedge pattern, with lower highs forming in 2026 and 2022 relative to the 2001 and 2002 highs.
The daily chart shows traders are trying to bid DXY towards 100, and with the July low at 100.14, that provides a potential resistance zone over the near term. But unless DXY goes into bullish overdrive soon, I will continue to seek evidence of a swing high up to 101.0 in anticipation of a breakdown from its rising wedge formation.
Two points I’d double-check against your chart before publishing: “2026 and 2022 relative to the 2001 and 2002 highs” may contain a year typo, and I changed “breakout” to “breakdown” because the context implies you are looking for a bearish resolution of the rising wedge.
Source: ICE, TradingView
Related tags:
Latest market news










Web Trader platform
Our sophisticated web-based platform is packed with features.
Open an account today
Experience award-winning platforms with fast and secure execution.
Economic calendar
Related articles

EUR/USD, AUD/USD, Gold Weekly Technical Outlook 8 31 2026
Sr. Technical Strategist Michael Boutros highlights the levels that matter on the Euro, Aussie and Gold this week.


FX Futures Positioning: Dollar Rebound Meets Diverging Forex Bets | COT Report
US dollar longs held firm into Jackson Hole, while euro, yen and commodity FX positioning diverged ahead of ISM and NFP.

Australian Dollar Outlook: AUD/USD Faces RBA-Fed Rate Tug-of-War
AUD/USD faces competing RBA and Fed hike bets this week, with Australian GDP and US payrolls set to test the eight-week rally.