


Forex Seasonality – September 2026: Can EUR/USD Extend its Gains to Three Straight Months?
Historically, September has been the second-strongest month for EUR/USD performance, with the world’s most widely-traded currency pair sporting an average return of +0.6% over the last 50+ years - see what other seasonal trends could impact the FX market this month!
Written by
Matt Weller
Head of Market Research
September Forex Seasonality Key Points
- Historically, September has been the second-strongest month for EUR/USD performance, with the world’s most widely-traded currency pair sporting an average return of +0.6% over the last 50+ years
- If there ever was a time to ignore long-term seasonal tendencies for USD/JPY, with intervention risk rising as USD/JPY approaches 161.00.
- With US-Canada trade tensions on the rise, any progress in negotiations around the USMCA and reductions of bilateral tariffs would be a bullish sign for the Loonie.
The beginning of a new month marks a good opportunity to review the seasonal patterns that have influenced the forex market over the 50+ years since the Bretton Woods system was dismantled in 1971, ushering in the modern foreign exchange market.
As always, these seasonal tendencies are just historical averages, and any individual month or year may vary from the historic average, so it’s important to complement these seasonal leans with alternative forms of analysis to create a long-term successful trading strategy. In other words, past performance is not necessarily indicative of future results.
Euro Forex Seasonality – EUR/USD Chart 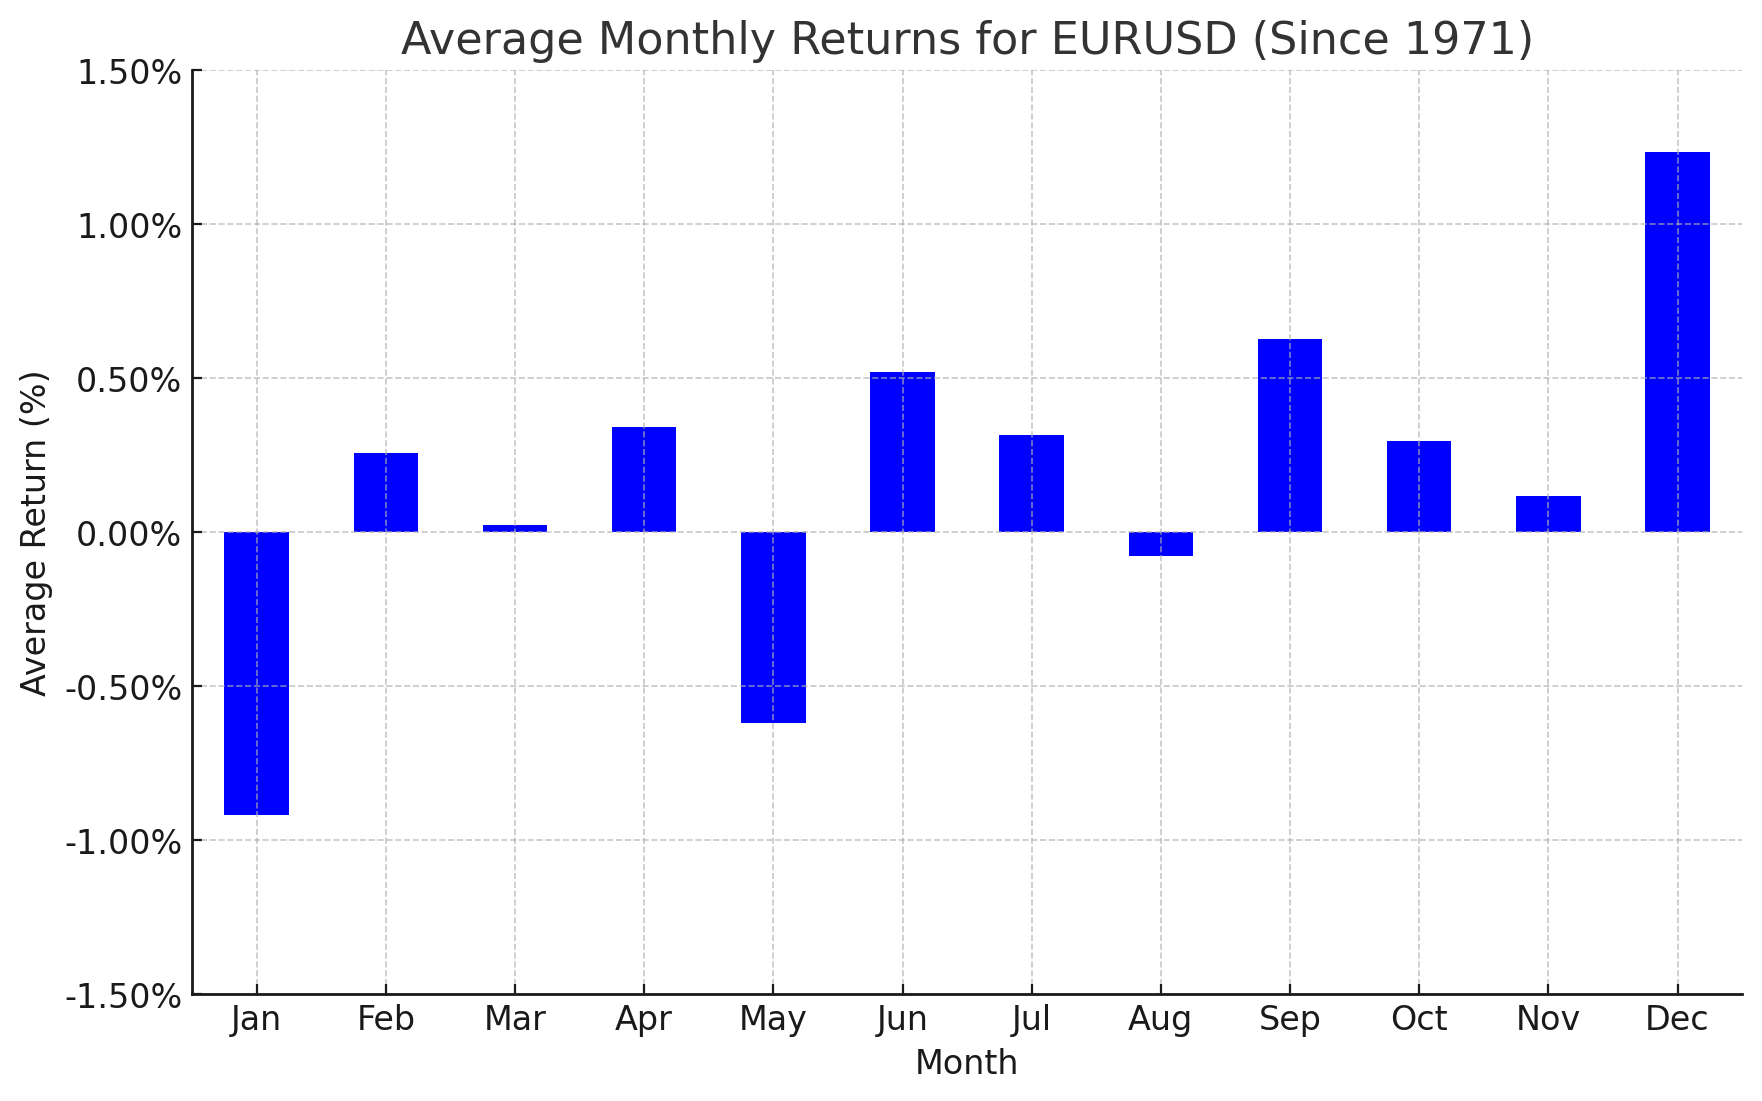
Source: TradingView, StoneX. Please note that past performance is not necessarily indicative of future results.
Historically, September has been the second-strongest month for EUR/USD performance, with the world’s most widely-traded currency pair sporting an average return of +0.6% over the last 50+ years. In August, EUR/USD bucked its seasonal weakness to rise 0.7%, though it finished well off its intra-month highs. With potential interest rate hikes from both the ECB and Fed (pending NFP and CPI data), the pair is likely to see significant volatility in September.
British Pound Forex Seasonality – GBP/USD Chart
Source: TradingView, StoneX. Please note that past performance is not necessarily indicative of future results.
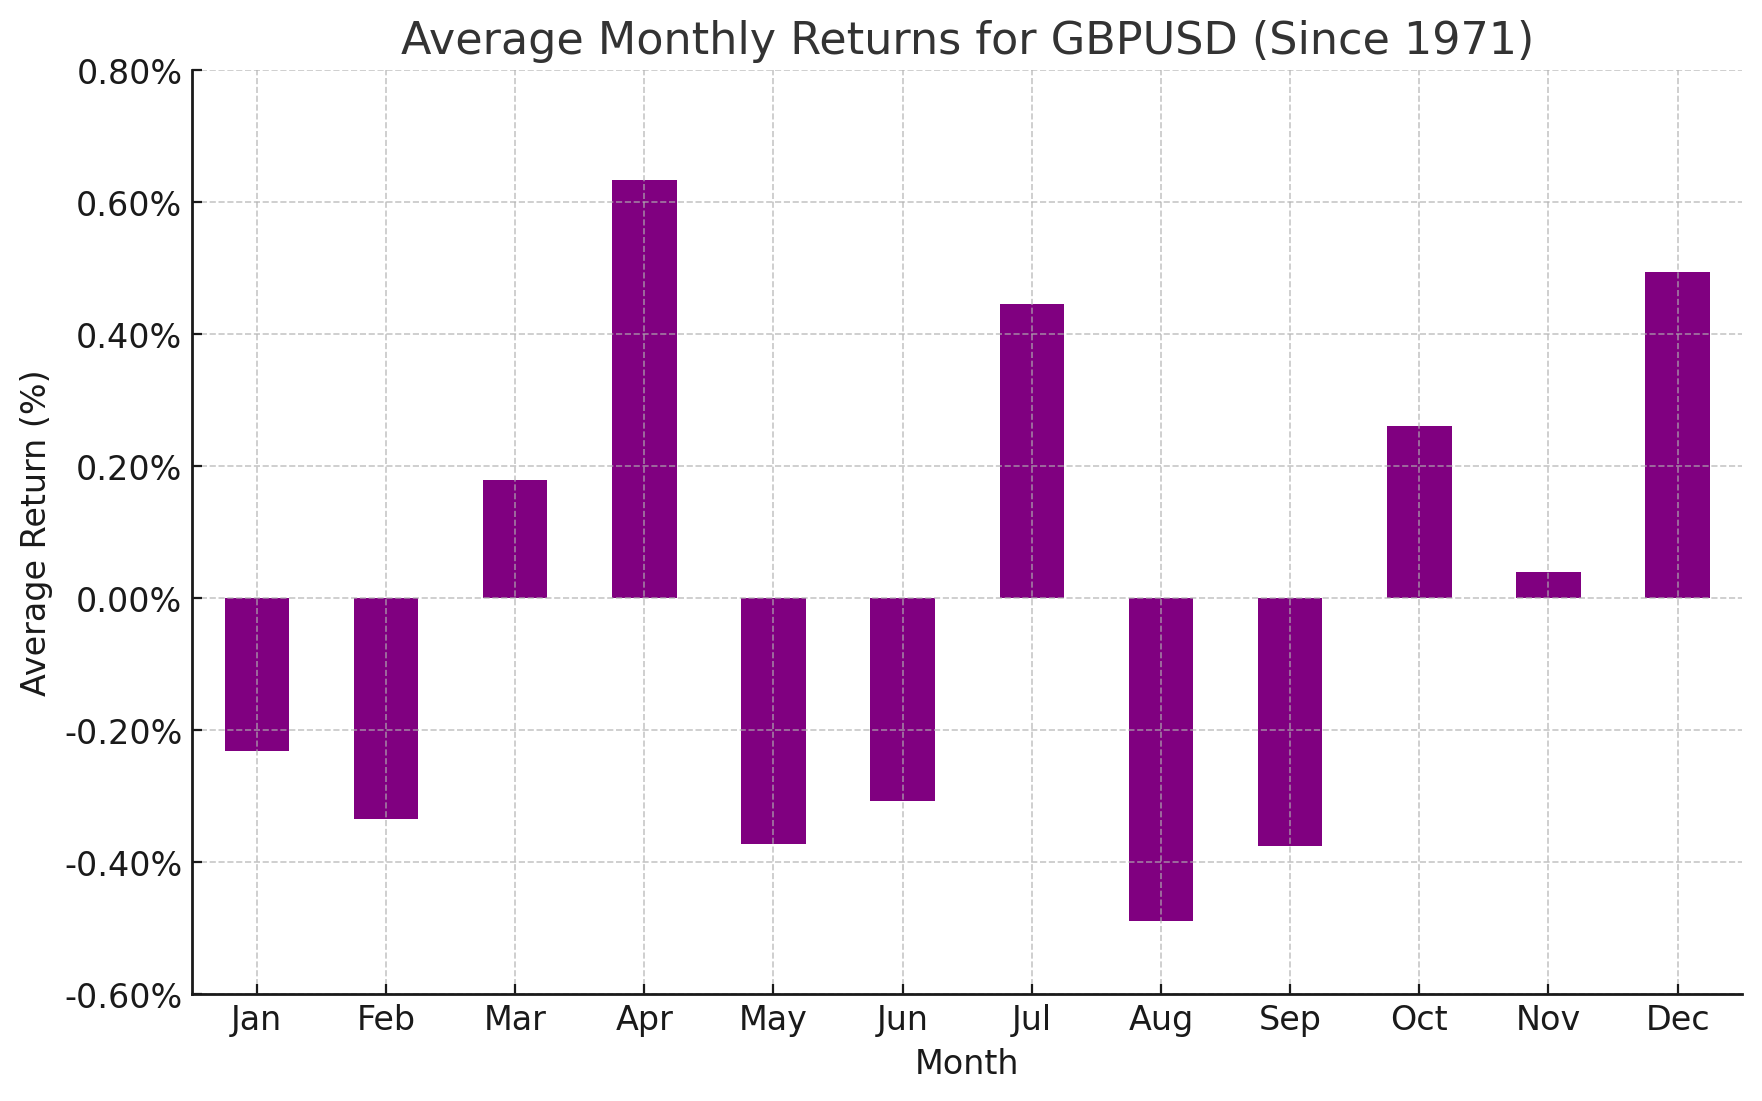
Looking at the above chart, GBP/USD has, on average, seen relatively weak monthly performance in September, with average returns of around -0.4% since 1971. Like the euro, the British pound gained ground against the greenback last month, with the early month gains partially unwinding into the close. For this month, the expectations for the Bank of England meeting are more muted (20% implied odds of a hike as of writing), so the major movements in GBP/USD this month are likely to come from the US dollar side of the pair.
Japanese Yen Forex Seasonality – USD/JPY Chart
Source: TradingView, StoneX. Please note that past performance is not necessarily indicative of future results.
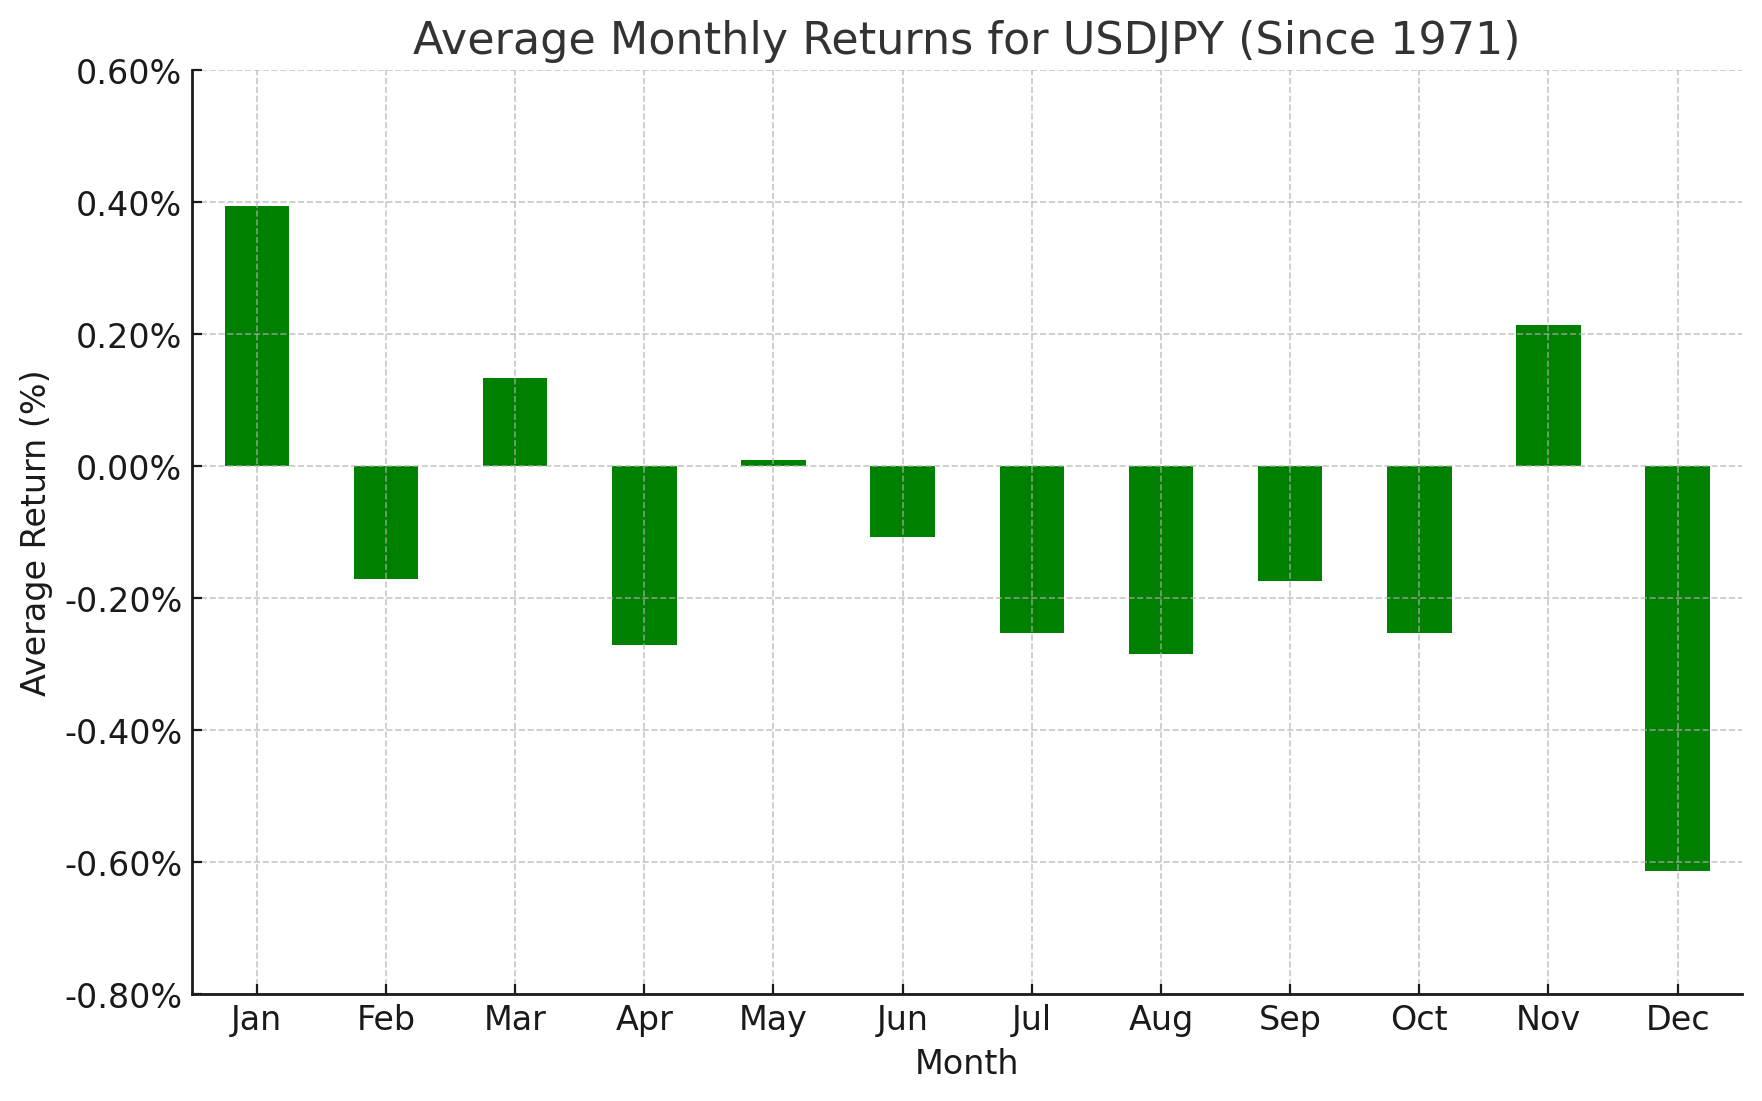
September has historically been a bearish month for USD/JPY, with the pair falling -0.2% on average since the Bretton Woods agreement. Of course, if there ever was a time to ignore long-term seasonal tendencies, this would be it. USD/JPY spent most of August unwinding the losses from the joint MoF/US Treasury intervention in late July. With US Treasury Secretary Bessent seemingly working in closer coordination with Japanese authorities, the political winds and risk of intervention, especially if USD/JPY edges toward 161, will be the key themes to watch this month.
Australian Dollar Forex Seasonality – AUD/USD Chart
Source: TradingView, StoneX. Please note that past performance is not necessarily indicative of future results.
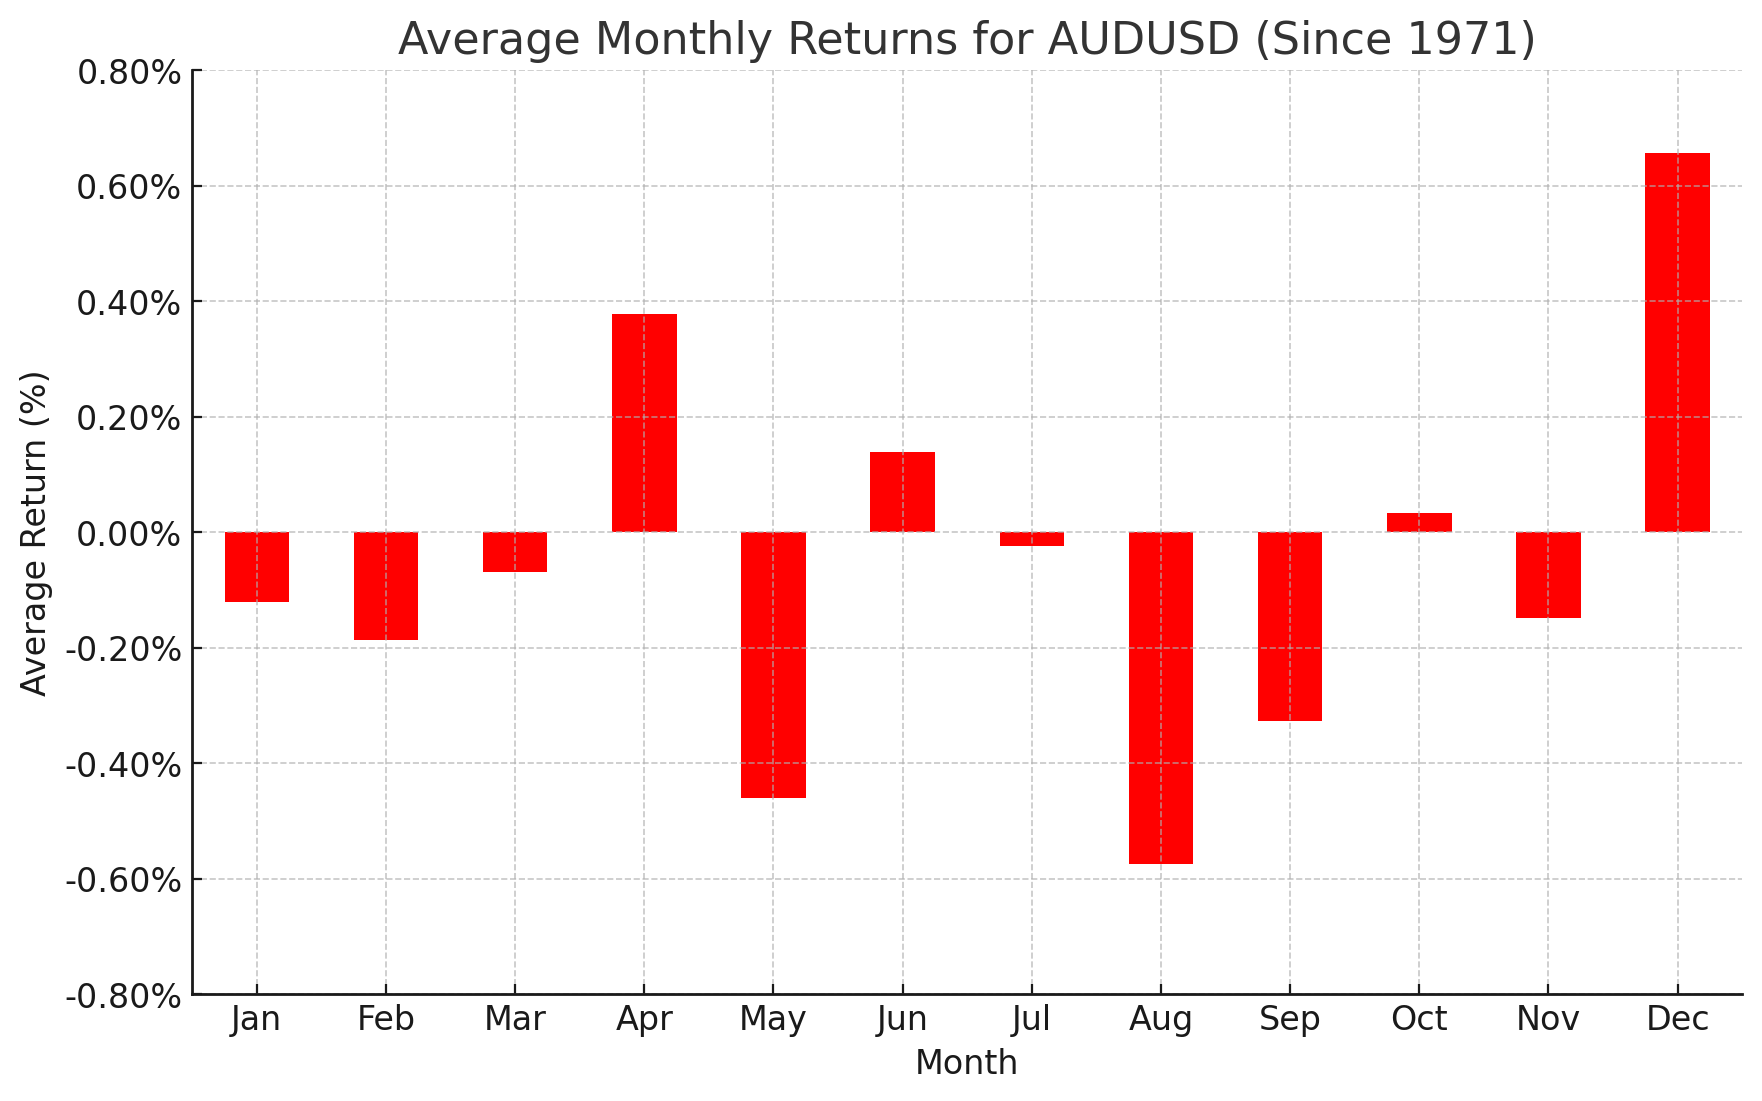
Turning our attention Down Under, AUD/USD has historically traded lower in September, with an average return of -0.3% going back to 1971. Last month, the Aussie defied its historical seasonal trend, rising by 1.8% amidst broad-based weakness in the US dollar and a recovery in risk appetite. As of writing, AUD/USD remains in a near-term bullish channel after finding resistance at the key 0.7200 level; a break below the bullish trend line this week would hint at a pullback in line with the seasonal tendency, whereas a confirmed break above 0.7200 would increase the odds of a bullish continuation toward the multi-year highs at 0.7275 next.
Canadian Dollar Forex Seasonality – USD/CAD Chart
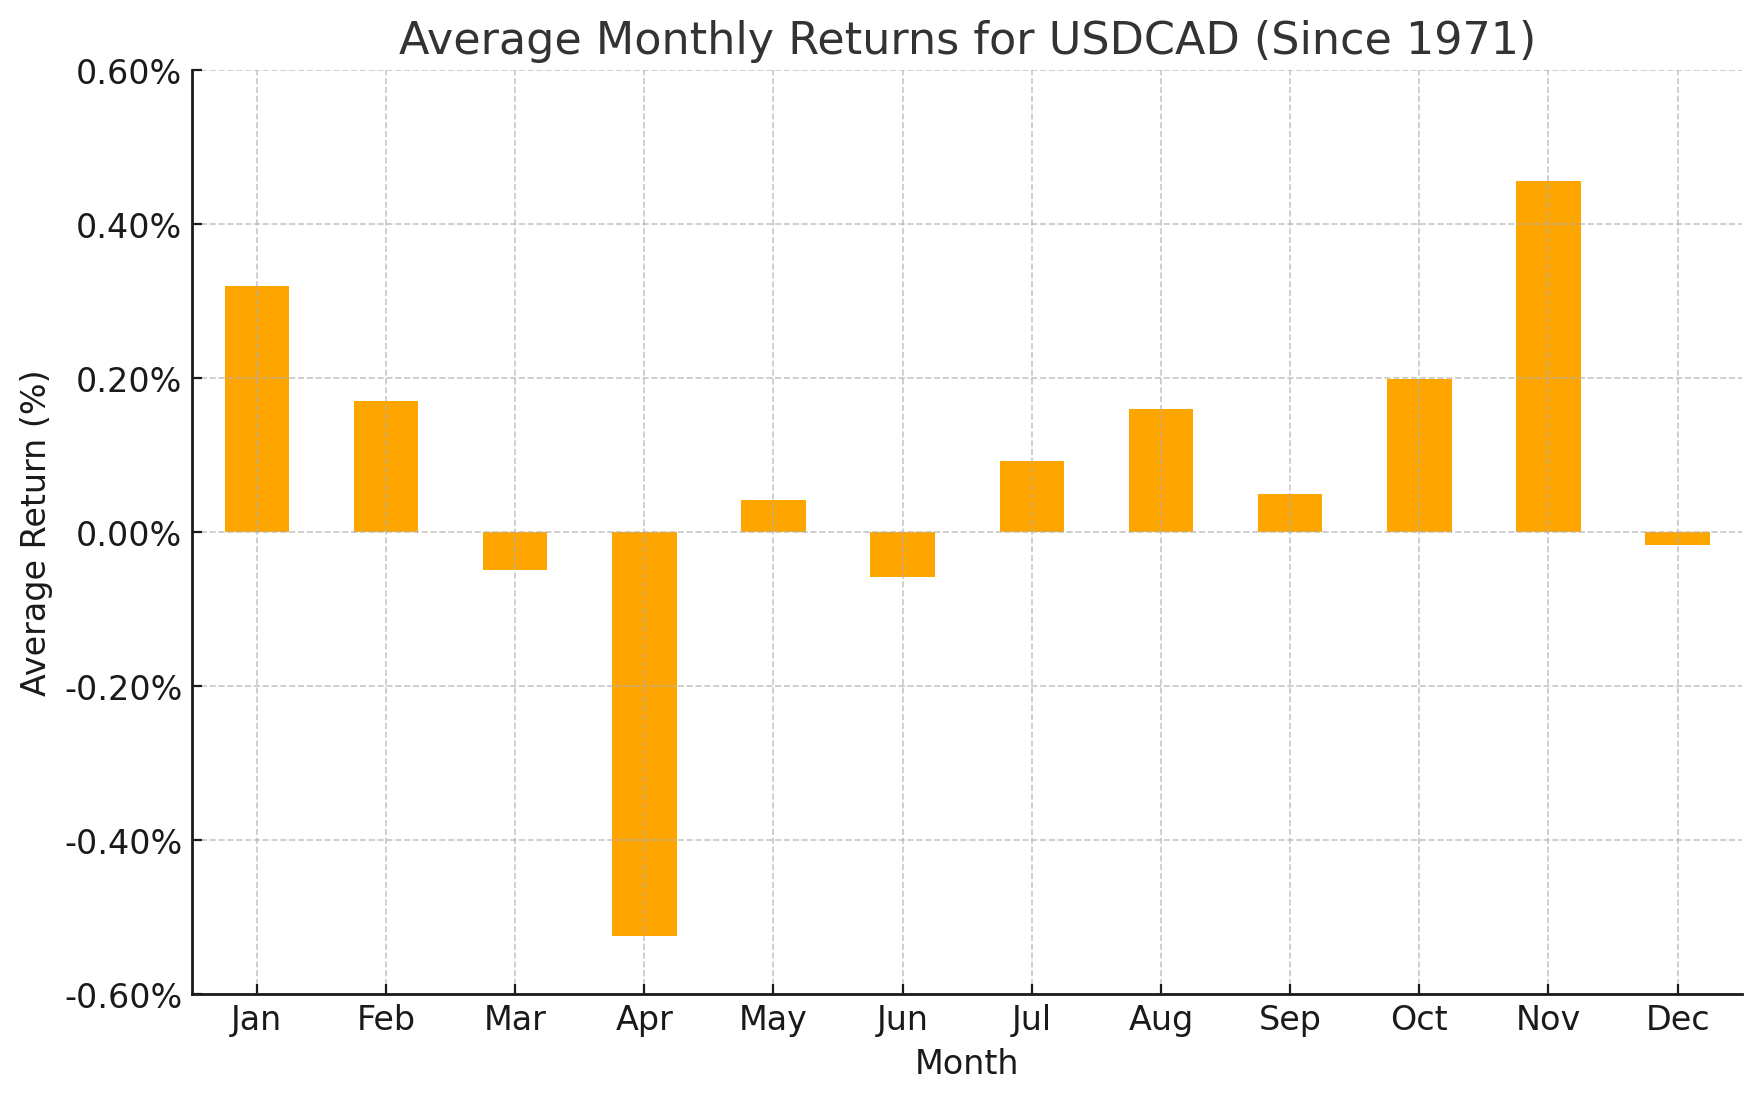
Source: TradingView, StoneX. Please note that past performance is not necessarily indicative of future results.
Last but not least, September has been a relatively neutral month on average for USD/CAD, with an average historical return of +0.1%. The North American pair dropped -1.2% in August as broad weakness in the US dollar trumped (pun intended) the resumption of the tit-for-tat tariff war between the US and Canada. Any progress in negotiations around the USMCA and reductions of bilateral tariffs would be a bullish sign for the Loonie, whereas escalation in the “trade war” could weigh on both currencies, but the impact on the Canadian Dollar would likely be larger, potentially supporting the pair in line with the longer-term seasonal tendency.
As always, we want to close this article by reminding readers that seasonal tendencies are not gospel – even if they’ve tracked relatively closely so far this year – so it’s important to complement this analysis with an examination of the current fundamental and technical backdrops for the major currency pairs.
-- Written by Matt Weller, Global Head of Research
Check out Matt’s Daily Market Update videos on YouTube and be sure to follow Matt on Twitter: @MWellerFX
Latest market news










Web Trader platform
Our sophisticated web-based platform is packed with features.
Open an account today
Experience award-winning platforms with fast and secure execution.
Economic calendar
Related articles

EUR/USD, AUD/USD, Gold Weekly Technical Outlook 8 31 2026
Sr. Technical Strategist Michael Boutros highlights the levels that matter on the Euro, Aussie and Gold this week.


FX Futures Positioning: Dollar Rebound Meets Diverging Forex Bets | COT Report
US dollar longs held firm into Jackson Hole, while euro, yen and commodity FX positioning diverged ahead of ISM and NFP.


Australian Dollar Outlook: AUD/USD Faces RBA-Fed Rate Tug-of-War
AUD/USD faces competing RBA and Fed hike bets this week, with Australian GDP and US payrolls set to test the eight-week rally.