


RBNZ Preview: The Hike Is Priced. The Track Is What Matters
Kiwi volatility could ramp up around today’s RBNZ decision, even with the rate hike almost fully priced. Falling inflation expectations and softer-than-forecast economic data raise the risk that the Bank’s updated OCR track fails to match hawkish market pricing.
Written by
David Scutt
Market Analyst
- RBNZ hike almost fully priced by markets today
- Market pricing far more hawkish than May forecasts
- Two-year inflation expectations fell sharply in August
- Key economic data have undershot RBNZ forecasts
- OCR track and vote split key for Kiwi
Kiwi Volatility Risk Returns
RBNZ day is here. Historically, these meetings have generated outsized volatility in the Kiwi, and today may be no exception.
With markets almost certain the RBNZ will hike rates, the reaction will likely come down to where the Bank’s updated overnight cash rate (OCR) track prints relative to expectations, along with the vote split from the Committee.
RBNZ Has a Hawkish Bar to Clear
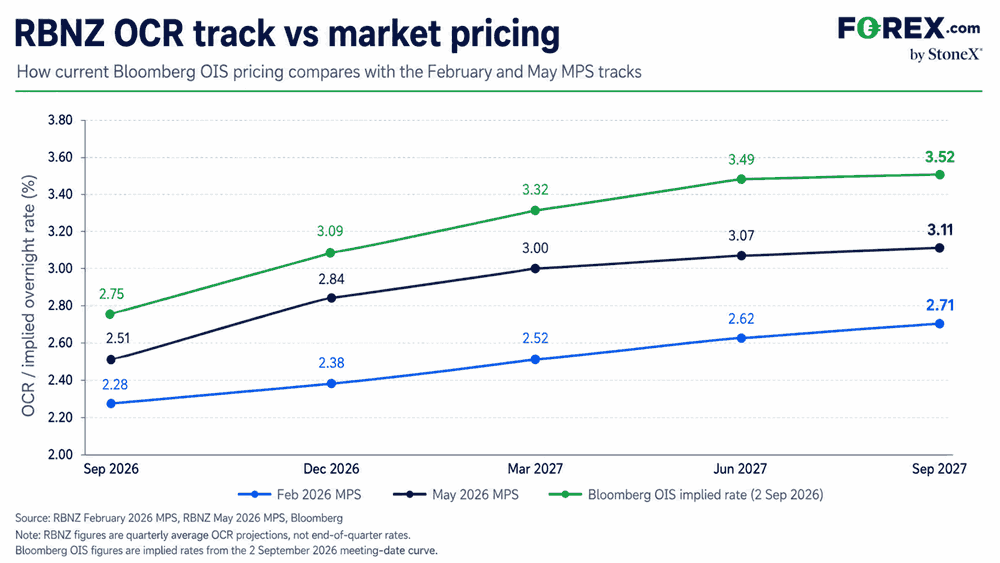
Markets see today’s hike as almost a lock, pricing around a 99% chance of a 25 basis point increase to 2.75%. Another move in October is around a two-in-three chance, making 3% by year-end the favoured outcome, with four hikes priced by the RBNZ’s August 2027 meeting.
Source: TradingView, FOREX.com
That is far more hawkish than the RBNZ’s May forecasts. The Bank had the OCR averaging 2.51% this quarter, 2.84% in December and 3.00% by March 2027. In February, those forecasts were just 2.28%, 2.38% and 2.52%.
That sets up the key question for today’s meeting: will the RBNZ hawk up enough to justify the hawkish repricing already seen in markets?
Historic Link Points to Dovish Risk
The RBNZ has a reputation for delivering surprises. History suggests that if we get another one today, it may be towards the more dovish side of the spectrum.
The key reason is inflation expectations, which are critical to the Bank’s sole mandate of price stability. In the latest survey released in August, the Bank’s key two-year inflation expectations measure fell sharply to 2.34% from 2.53%.
Historically, moves like that have rarely been followed by an immediate hike. There have been 11 occasions over the past two decades when two-year expectations fell into the 2.25% to 2.50% range. The RBNZ hiked at the following meeting just once.
Markets clearly think that historic relationship will be broken today. But even if the Bank does hike, it raises questions over whether it will be willing to signal a much more aggressive rate track, particularly with evidence that the Kiwi economy is nowhere near as strong as it previously anticipated.
Softer Data Challenge Hawkish Pricing
Source: TradingView, FOREX.com
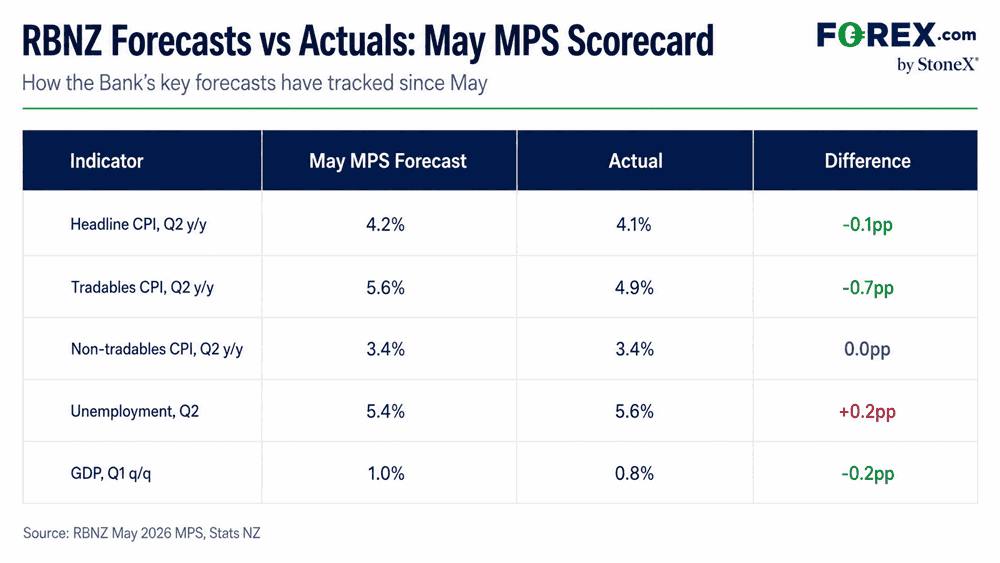
That point is rammed home by the graphic above. Relative to the Bank’s forecasts three months ago, the key measures have either come in weaker or in line with expectations. Nothing has beaten.
Headline CPI came in at 4.1% against 4.2% expected, while non-tradables inflation, the more domestically driven measure, matched the Bank’s 3.4% forecast.
Growth also disappointed, with March-quarter GDP rising 0.8% against the Bank’s 1.0% forecast, while unemployment climbed to 5.6% against 5.4% expected. That points to more persistent and growing labour market slack, which would normally diminish the risk of a sustained domestic, wages-driven inflation breakout.
Watch the Vote Split
Aside from the updated rate track, the other thing to watch in the statement is the vote split and how the Committee arrived at the final decision.
At the previous meeting, Governor Anna Breman, Chief Economist Paul Conway and Assistant Governor Karen Silk, along with external member Carl Hansen, judged the risks to the inflation outlook as broadly balanced. External members Prasanna Gai and Hayley Gourley saw the risks as skewed to the upside.
Any shift in that split will matter. If more members move towards the upside-risk camp, that would reinforce a hawkish message. If the debate shifts towards a more balanced view, that would blunt Kiwi upside and could spark outright downside.
Kiwi Downside Risk Starts to Build
Source: TradingView
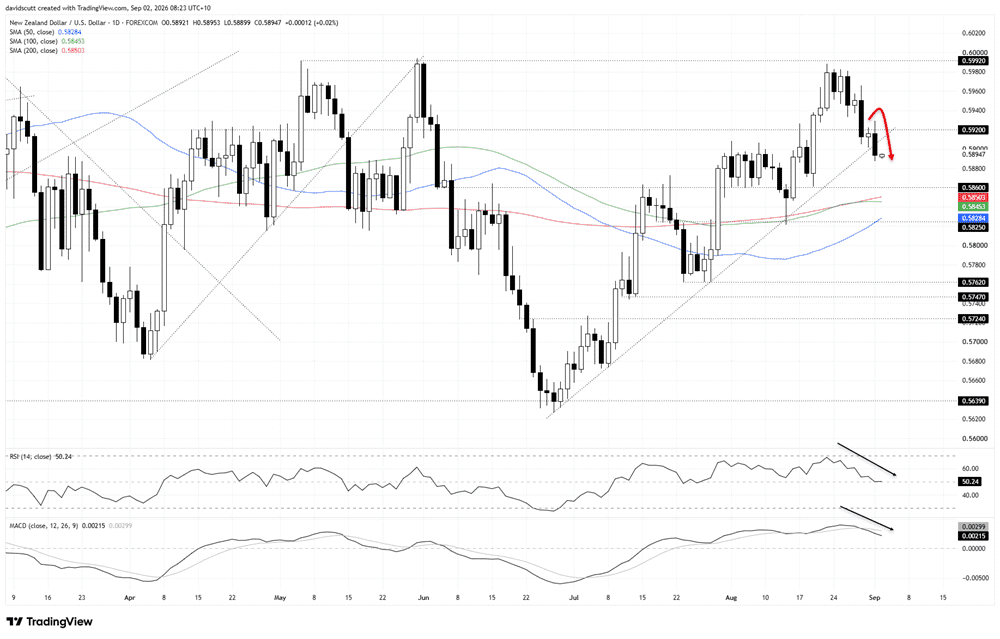
From a technical perspective, there was a key development on Tuesday with NZD/USD breaking beneath uptrend support running from the lows set in late June.
An early-session rally faltered above 0.5920, a level that has consistently acted as resistance over periods this year, ultimately delivering the break and close beneath the uptrend. The oscillators are also turning more neutral, with RSI (14) setting lower highs and now back around 50, while MACD has staged a bearish crossover of the signal line despite remaining in positive territory.
You get the sense directional risk for the Kiwi may be starting to shift lower, bringing support at 0.5860 into play, followed by the confluence of the 100 and 200-day moving averages around 0.5850 and the 50-day moving average near 0.5825. If the latter gives way, it may embolden bears to look for a deeper unwind back into the 0.57 region.
Of course, a hawkish surprise today could see the price jammed back above 0.5920. If that happens, the late-August highs above 0.5980 would come back into view, followed by the double top at 0.5992 set in May and June.
AUD/NZD Breakout Extends
Source: TradingView
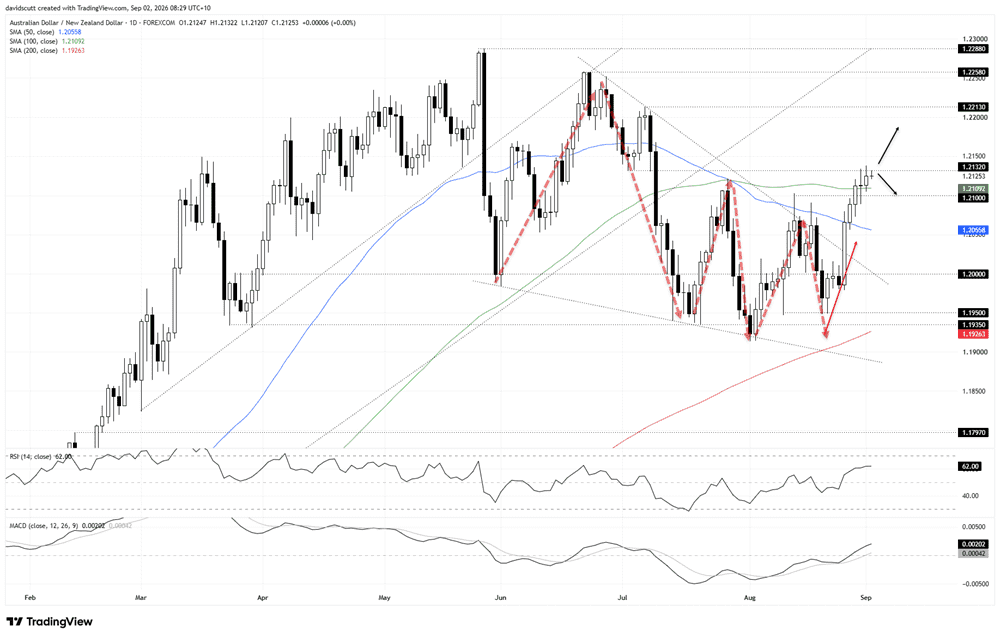
As correctly anticipated last week, AUD/NZD has pushed back to levels not seen since early July following the break of a bullish wedge structure that had been in place for several months.
The move has seen the pair reclaim the 50 and 100-day simple moving averages, along with minor resistance at 1.2100. Right now, the pair is capped beneath 1.2132, a level that previously acted as support and has now been tested on several occasions as resistance. It’s the immediate focal point overhead, with a break above pointing to an extension towards the July 7 swing high at 1.2213. Above that, 1.2258 and 1.2288 are the next levels of note.
If there was to be a hawkish surprise from the RBNZ today, it would point to downside risk for AUD/NZD, bringing the 100-day simple moving average at 1.2109 and 1.2100 into play initially. A break beneath the latter may improve the probability of a reversal back towards former wedge resistance and support at 1.2000.
The oscillators currently favour long setups over shorts with RSI (14) trending higher above the neutral 50 level at 62. MACD is confirming the message, having crossed the signal line from below and flipped positive. For the moment, buying dips and bullish breakouts is therefore favoured.
Latest market news










Web Trader platform
Our sophisticated web-based platform is packed with features.
Open an account today
Experience award-winning platforms with fast and secure execution.
Economic calendar
Related articles

EUR/USD, AUD/USD, Gold Weekly Technical Outlook 8 31 2026
Sr. Technical Strategist Michael Boutros highlights the levels that matter on the Euro, Aussie and Gold this week.


FX Futures Positioning: Dollar Rebound Meets Diverging Forex Bets | COT Report
US dollar longs held firm into Jackson Hole, while euro, yen and commodity FX positioning diverged ahead of ISM and NFP.


Australian Dollar Outlook: AUD/USD Faces RBA-Fed Rate Tug-of-War
AUD/USD faces competing RBA and Fed hike bets this week, with Australian GDP and US payrolls set to test the eight-week rally.