

Bitcoin Price Forecast: BTC/USD Recovery Extends 20% as Bulls Eye Key Resistance 8 19 2026
Bitcoin broke out of the August range today and the next technical hurdle could determine whether a larger trend reversal is taking shape.
Written by
Michael Boutros
Sr. Technical Strategist
Bitcoin Technical Forecast: BTC/USD Weekly & Daily Trade Levels
- Bitcoin has rallied more than 20% from the yearly low, with the August range breakout extending to fresh multi-month highs.
- BTC/USD is trading at its highest levels since early June as bullish momentum reaches the highest levels of the year.
- The advance is approaching a major resistance confluence where buyers will need follow-through to strengthen the reversal case.
- Stabilization above the August breakout zone would keep the advance viable, with a break above resistance needed to expose the next phase of the recovery.
Bitcoin is poised to register its largest single-day advance since March as a breakout of the August opening range drives BTC/USD to its highest levels since early June. The sharp acceleration has strengthened the near-term technical picture, but the advance is now approaching a major resistance confluence where buyers will need to prove they can sustain control. The immediate focus is on whether Bitcoin can stabilize above the former range high and extend the breakout, keeping the prospect of a larger trend reversal in play. Battle lines drawn on the BTC/USD technical charts.
Review my latest Weekly Strategy Webinar for an in-depth breakdown of this Bitcoin setup and more. Join live on Monday’s at 8:30am EST.
Bitcoin Price Chart – BTC/USD Weekly
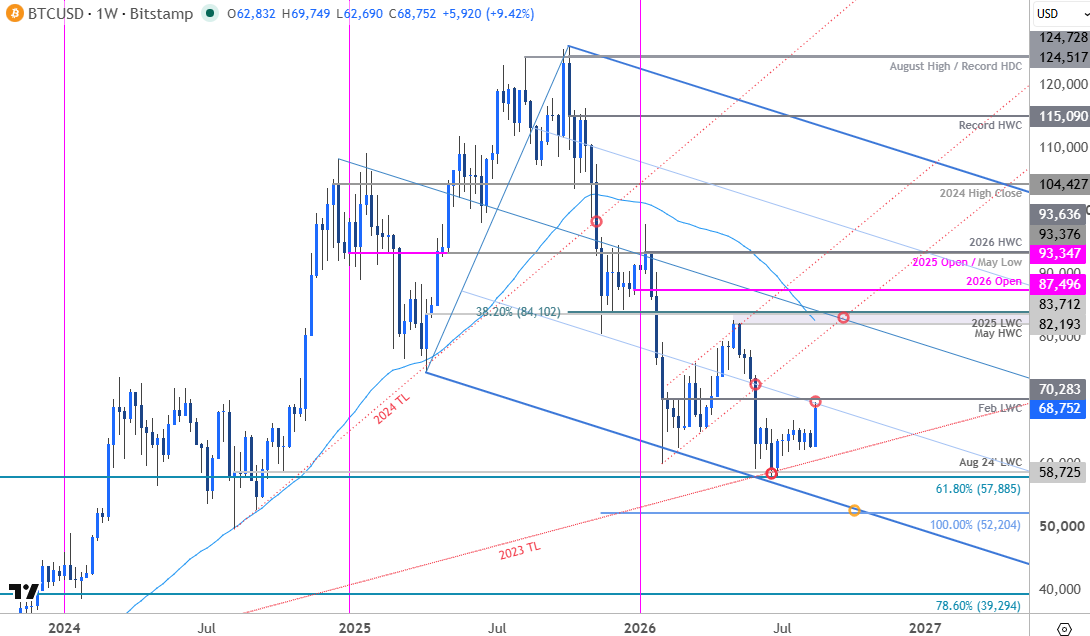
Chart Prepared by Michael Boutros, Sr. Technical Strategist; BTC/USD on TradingView
In last month’s Bitcoin Forecast we noted that BTC/USD had rebounded off major technical support and that, “From a trading standpoint, losses would need to be limited to 61,244 IF price is heading higher on this stretch with a breach / weekly close above 67,322 needed to suggest a more significant low was registered this month.” Bitcoin fell more than 7% from the July high with price registering an intraday low at 62,217 before rebounding into the monthly open. A breakout off the August opening-range today has already extended more than 11.6% off the monthly low with BTC/USD trading at the highest levels since early-June.
The advance is now approaching initial resistance at the February low-week / low-day closes (LWC & LDC) at 70,283/531. Note that the numerous slopes on both timeframes converge on this zone over the next few weeks and a breach / weekly close above is needed to suggest a more significant low is in place, and a fuel the next leg of the recovery.
Bitcoin Price Chart – BTC/USD Daily
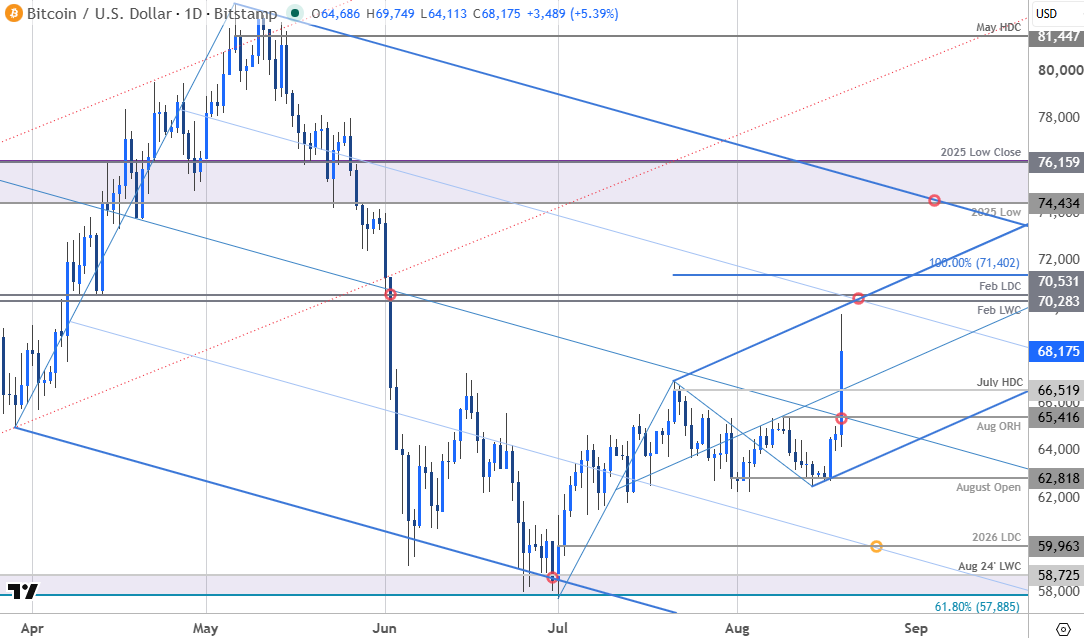
Chart Prepared by Michael Boutros, Sr. Technical Strategist; BTC/USD on TradingView
A closer look at the Bitcoin daily chart shows BTC/USD trading within the confines of an ascending pitchfork extending off the July low with the upper parallel further highlighting confluent resistance at 70,283/531. Subsequent resistance is eyed at the 100% extension of the July advance at 71,402 and the 2025 low / low-close 74,434-76,159. Note that the upper parallel of the May downtrend converges on this zone into early-September- look for a larger reaction there IF reached.
Initial support rests with the July high-day close (HDC) at 66,519 and is backed by the August opening range high at 65,416- losses below this level would invalidate today’s breakout. A break / daily close below the monthly open at 62,818 would ultimately be needed to mark resumption of the broader downtrend. Subsequent support rests with the yearly low-day close at 59,963.
Bottom line: Bitcoin has broken the August range with the rally now approaching confluent resistance and the immediate focus is on whether the bulls can stabilize the breakout. From a trading standpoint, losses would need to be limited to 65,416 IF price is heading higher on this stretch with a close above 71,402 needed to fuel the next major leg of the rally. Stay nimble here and watch the weekly closes for guidance.
Active Weekly Technical Charts
- British Pound (GBP/USD)
- Gold (XAU/USD)
- Euro (EUR/USD)
- Swiss Franc (USD/CHF)
- US Dollar Index (DXY)
- Australian Dollar (AUD/USD)
- Canadian Dollar (USD/CAD)
- S&P 500, Nasdaq, Dow
- Japanese Yen (USD/JPY)
--- Written by Michael Boutros, Senior Technical Strategist
Follow Michael on X @MBForex






Web Trader platform
Our sophisticated web-based platform is packed with features.
Open an account today
Experience award-winning platforms with fast and secure execution.
Economic calendar
Related articles

Canadian Dollar Forecast: USD/CAD Weekly Reversal Puts Yearly Uptrend Back in Focus 8 29 2026
USD/CAD has staged its strongest weekly advance since June, shifting the focus to whether a more durable low is finally taking shape.

USD/JPY weekly outlook: Payrolls may challenge the Fed’s hawkish reset
USD/JPY has finally woken from its slumber. Payrolls now loom as the key test of whether the latest hawkish repricing sticks or sinks.


Euro Short-term Outlook: EUR/USD Pullback Nears Pivotal Uptrend Support 8 28 2026
Warsh's comments accelerated the EUR/USD selloff, raising the stakes as buyers look to stabilize the broader recovery.