


S&P 500, Nasdaq, Dow Forecast: Bulls Face Their Biggest Test of the Summer 7 26 2026
Major U.S. indices enter Fed week at pivotal technical levels as weakening momentum raises the stakes for the next breakout.
Written by
Michael Boutros
Sr. Technical Strategist
Equity Indices Technical Forecast: Weekly Trade Levels
- U.S. equities closed broadly lower this week, with the Nasdaq falling 1.8%, the S&P 500 down 0.66%, and the Dow slipping 0.38%.
- The S&P 500 is testing a pivotal technical support zone with a multi-week consolidation pattern preserved just above- breakout in focus
- Nasdaq momentum has deteriorated sharply as the index threatens a breakdown from key trend support.
- Dow lower for a third week after turning from major resistance- broader uptrend remains intact with initial support in view
- Major event risk next week with FOMC rate decision and PCE inflation data on tap.
Review my latest Weekly Strategy Webinar for an in-depth breakdown of these equity indices and more. Join the session or stream live on YouTube on Monday’s at 8:30am EST.
S&P 500 Price Chart – SPX500 Weekly
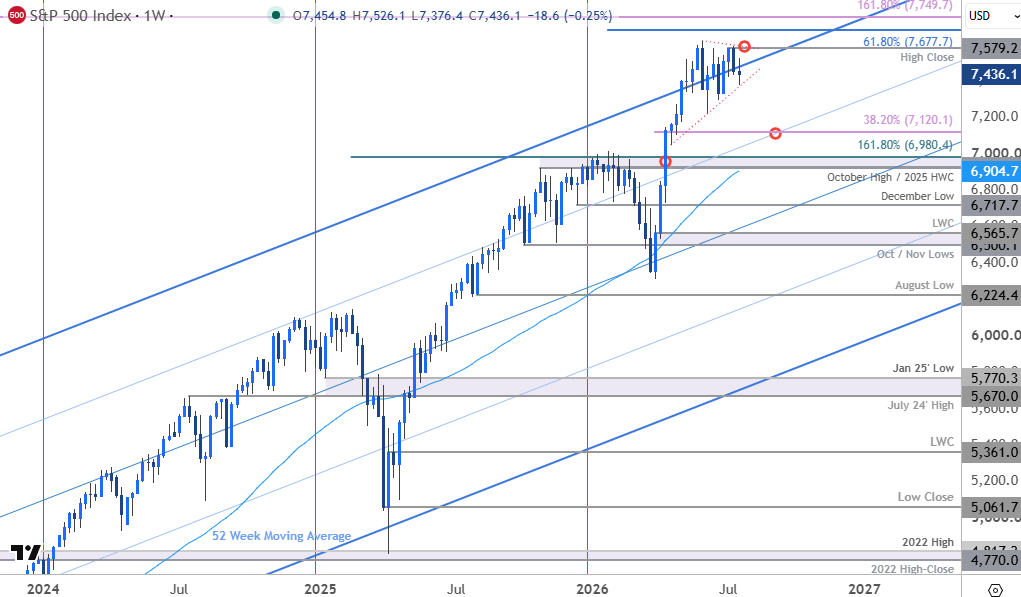
Chart Prepared by Michael Boutros, Sr. Technical Strategist; S&P 500 on TradingView
Technical Outlook: The SPX500 has been straddling the upper parallel of a multi-year uptrend for nearly three-months with the index trading within the confines of a massive consolidation pattern just below the record high. The focus is on a breakout of this contractionary range for guidance with weekly momentum divergence suggesting the broader rally may be vulnerable to a larger pullback within the broader uptrend.
S&P 500 Price Chart – SPX500 Daily
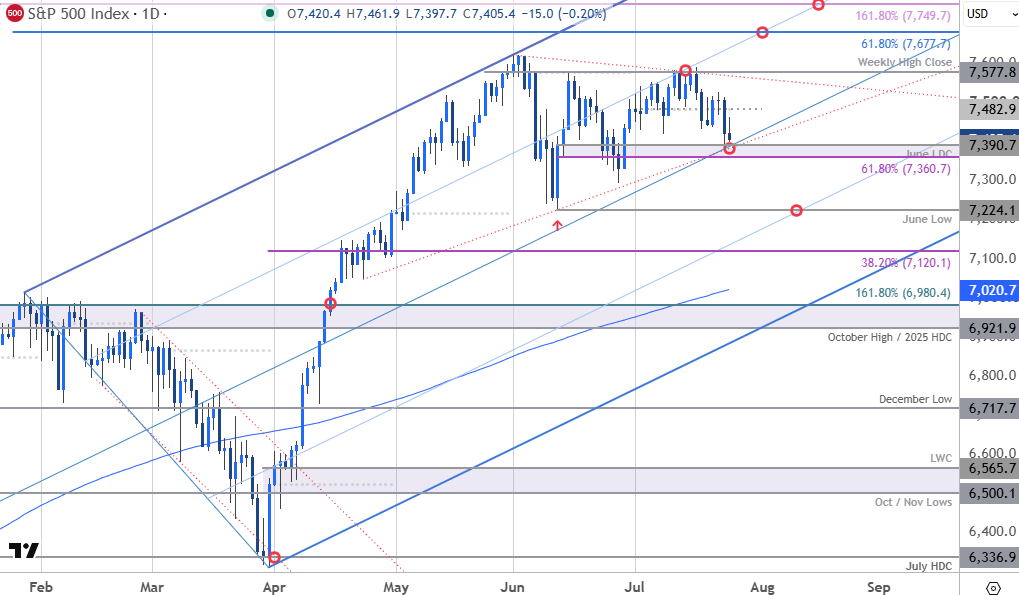
Chart Prepared by Michael Boutros, Sr. Technical Strategist; S&P 500 on TradingView
A closer look at the S&P 500 daily chart shows the index continuing to trade within the confines of an ascending pitchfork we have been tracking off the yearly (April) low. Note that the median now converges on confluent support at the 61.8% retracement of the June rally and the June low-day close (LDC) at 7361/91. The lower bounds of the multi-month consolidation pattern (red) also converges on this zone and a break / daily close below would suggest a more significant correction is underway. Subsequent support objectives rests with the June low at 7224 and the 38.2% retracement of the yearly range at 7120. Key support and broader bullish invalidation rests more than 9% off the highs at 6922/80- a region defined by the October high, the 2025 high-day close (HDC), and the 1.618% extension of the 2025 opening range. The lower parallel converges on this zone into mid-August.
Monthly open resistance stands at 7483 and is backed by the record weekly high-close at 7578. A breach / weekly close above this threshold is needed to validate a breakout June consolidation range and mark resumption of the broader uptrend. Subsequent resistance objectives eyed at the 61.8% extension of the 2025 rally at 7678 and the 1.618% extension of the broader 2020 advance at 8755.
Bottom line: The S&P 500 testing pivotal technical support at the lower bounds of a multi-month consolidation pattern. The focus is on a breakout of the 7361-7578 range for guidance in the weeks ahead. From a trading standpoint, losses would need to be limited to the median-line IF price is heading higher on this stretch with a breach of the monthly high needed to fuel the next major leg of the advance.
Keep in mind that while AI remains the market's primary leadership group, one of the more constructive developments has been the gradual expansion of participation into other sectors. Financials, energy, healthcare and selected industrials have begun absorbing some of the leadership burden as several mega-cap technology stocks consolidate. Although breadth indicators remain mixed, continued rotation beyond AI would provide a healthier foundation for the broader bull market.
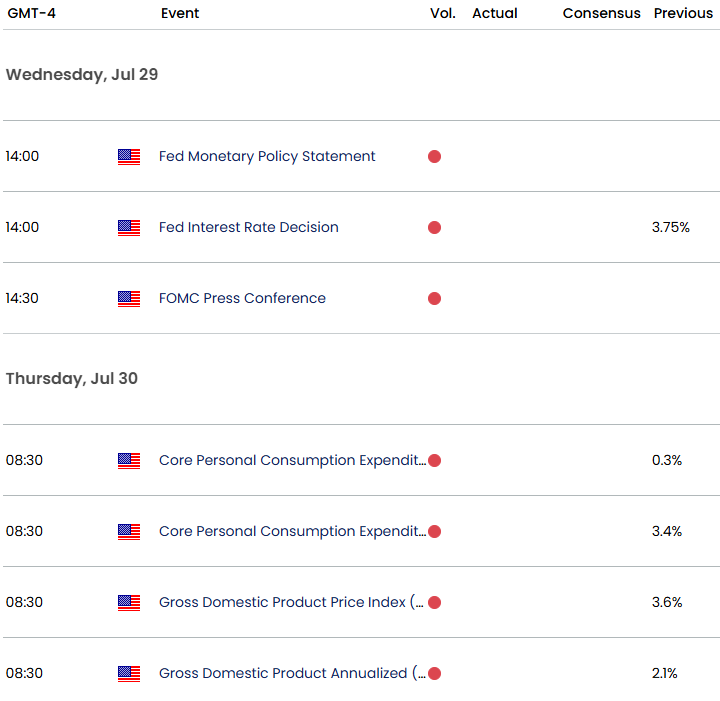
Markets will turn their attention to Wednesday's FOMC decision and Thursday's Core PCE inflation report, the Fed's preferred gauge of underlying inflation. Although policymakers are widely expected to keep rates unchanged, the combination of the policy statement and inflation data will be critical in shaping expectations for the remainder of the year. Evidence of persistent inflation would likely reinforce expectations for additional Fed tightening, raising discount rates and creating a less favorable backdrop for equities. Fed funds futures currently price a 64% probability of no change next week, while implying an 80% chance of a 25-basis-point rate hike in September. Stay nimble into the release and watch the weekly close on Friday for guidance.
Nasdaq Price Chart – NDX Weekly
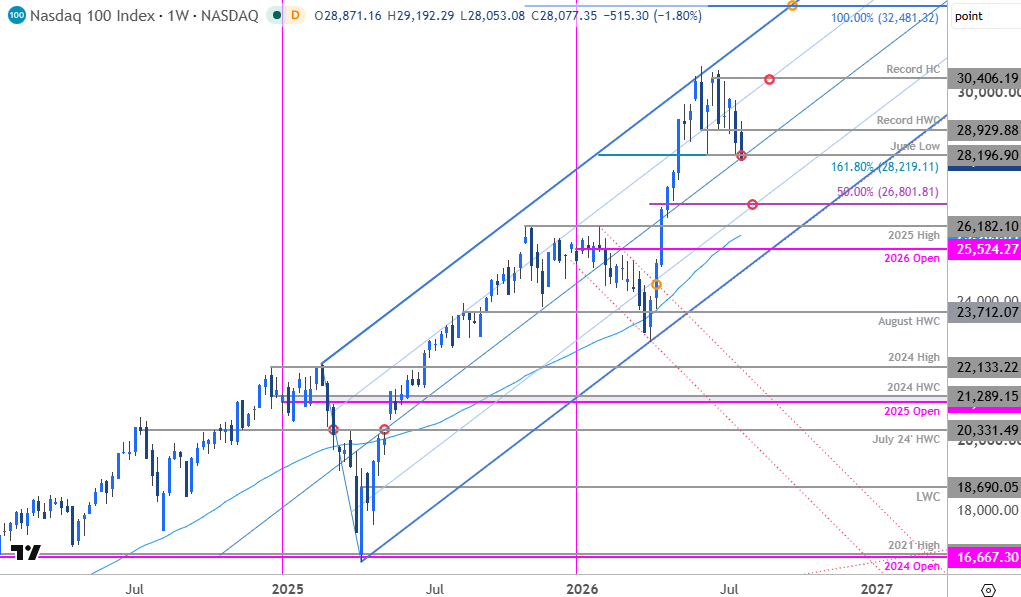
Chart Prepared by Michael Boutros, Sr. Technical Strategist; NDX on TradingView
Technical Outlook: Nasdaq was the worst performer last week with the index falling 1.8% to close just below a key support zone at 28,197/219. This level is defined by the 1.618% extension of the 2026 opening range & the June swing low and converges on the median line of the 2025 pitchfork. Weekly & daily momentum have now fallen to the lowest levels since the April breakout, and the momentum profile favors the bears while below this slope.
Weekly support now rests with the 50% retracement of the yearly range, which converges on the 25% parallel over the next few weeks at 26,801. Subsequent support objectives rests at the 2025 swing high at 26,182 and the yearly open at 25,524.
Look for initial resistance at the record high-week close (HWC) at 28,930 and is backed by the record high-close (HC) at 30,406. Note that the 75% parallel converges on this level mid-August and a breach / weekly close above is needed to mark resumption of the broader uptrend towards the 100% of the 2025 advance at 32,481.
Bottom line: Nasdaq is tempting a break below confluent support and IF this breakdown is legit, the threat for further losses remains into the close of the month. From a trading standpoint, the risk is titled to the downside while below 28,930- look for a larger reaction on stretch towards 26,800 IF reached with a close above 30,406 needed to fuel the next major leg of the rally.
Dow Jones Price Chart – DJI Weekly
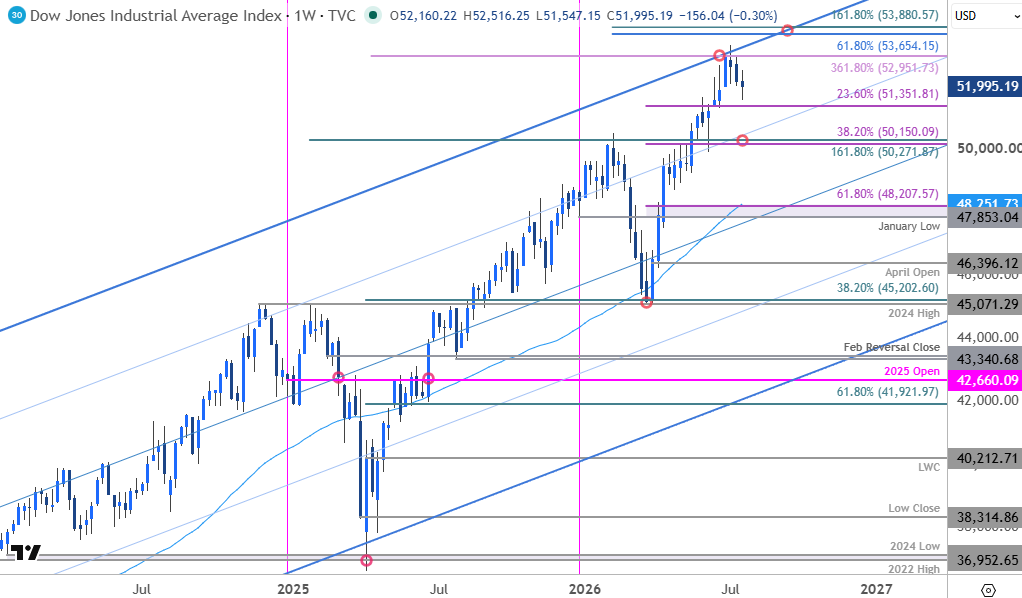
Chart Prepared by Michael Boutros, Sr. Technical Strategist; DJI on TradingView
Technical Outlook: The Dow exhausted into confluent resistance into the open of the month at the 3.618% extension of the 2025 advance near 52,952. Note that the upper parallel of the 2022 pitchfork converged on this level with the index marking a third consecutive weekly decline off uptrend resistance.
Initial support rests with a basic 23.6% retracement of the yearly range at 51,352 and is backed by key support at 50,272/150. This region is defined by the 38.2% retracement, the 1.618% extension of the 2025 opening range, and the February highs. Note that the 75% parallel converges on this level and losses below this slope would be needed to suggest a more significant high is in place and a larger correction is underway. Key support and broader bullish invalidation rests with the January low, the 61.8% retracement and the 52-week moving average at 47,853-48,250.
A topside breach / weekly close above 52,952 is needed fuel the next leg of the advance towards subsequent resistance at the 61.8% extension of the 2025 advance at 53654 and the 1.618% extension of the 2026 opening range at 53,881. Note that the upper parallel converges on this zone into the close of the August- look for a larger reaction there IF reached.
Bottom line: The Dow turned from confluent uptrend resistance into the start of the with the subsequent reversal now approaching initial support. From a trading standpoint, losses would need to be limited to 50,150 IF price is heading higher on this stretch with a close above 52,952 needed to fuel the next leg of the rally.
Key US Economic Data Releases
Active Weekly Technical Charts
- Bitcoin (BTC/USD)
- Japanese Yen (USD/JPY)
- Euro (EUR/USD)
- Swiss Franc (USD/CHF)
- Gold (XAU/USD)
- British Pound (GBP/USD)
- Australian Dollar (AUD/USD)
- US Dollar Index (DXY)
- Canadian Dollar (USD/CAD)
--- Written by Michael Boutros, Senior Technical Strategist
Follow Michael on X @MBForex







Web Trader platform
Our sophisticated web-based platform is packed with features.
Open an account today
Experience award-winning platforms with fast and secure execution.
Economic calendar
Related articles

Euro Short-term Outlook: EUR/USD Pullback Nears Pivotal Uptrend Support 8 28 2026
Warsh's comments accelerated the EUR/USD selloff, raising the stakes as buyers look to stabilize the broader recovery.

Gold and S&P 500 analysis: What now after Warsh’s hawkish speech?
The dollar surged across the board after the Fed Chair Kevin Warsh surprised with a hawkish-leaning speech at the Jackson Hole summit. All the bearish dollar bets that had been accumulated since last Friday on the back of data weakness and bond market troubles had to be squared and that triggered a short squeeze rally for the dollar. Gold and silver dropped, as a result, as too did bitcoin, while US indices were giving back earlier gains.


Nasdaq 100 Forecast: NDX slips ahead of Fed Chair Warsh’s speech
U.S. stocks are edging lower on Friday, giving back some of yesterday's gains after Nvidia's strong outlook revived the tech trade. The focus has now shifted firmly to Fed Chair Kevin Warsh's Jackson Hole speech, with investors looking for more clarity on the outlook for interest rates.
