


Australian Dollar Forecast: AUD/USD Three-Week Range Nears a Breakout 7 30 2026
AUD/USD has spent three weeks trapped beneath resistance, with the next decisive move likely to shape the August outlook.
Written by
Michael Boutros
Sr. Technical Strategist
Australian Technical Forecast: AUD/USD Weekly Trade Levels
- AUD/USD has stalled beneath the monthly high after rallying in four of the past five weeks.
- Aussie has traded within a well-defined range below resistance for three consecutive weeks.
- A breakout from the current range to provide important directional guidance into August.
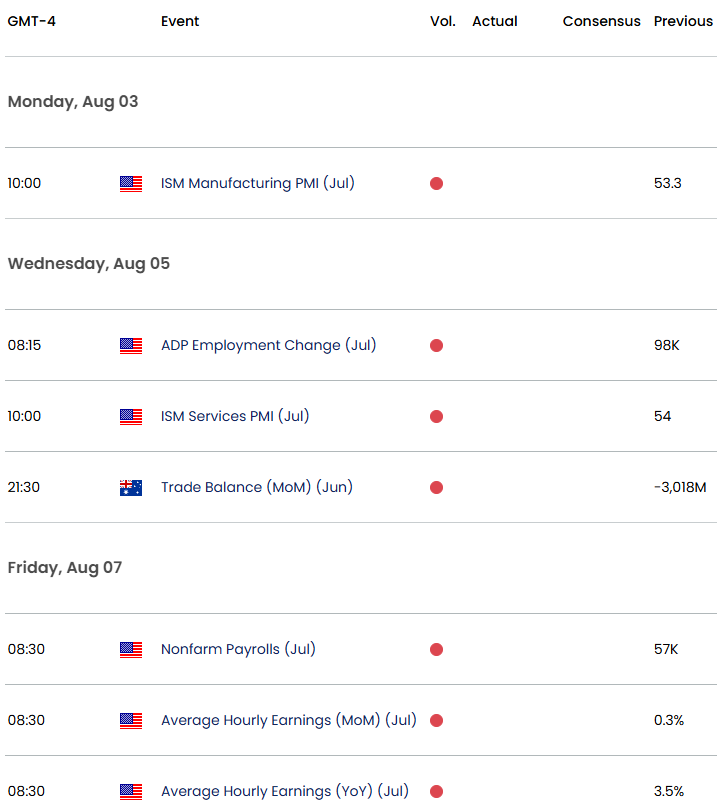
- Event risk on tap into the August open: US ISM services & manufacturing data, ADP employment, and NFPs
- Resistance 7023, 7116/20 (key), 7208/14- Support 6927, 6877/80 (key), ~6825
AUD/USD heads into the July close locked in a well-defined three-week range just beneath major resistance, leaving the pair at a pivotal technical inflection point. Buyers continue to pressure the upper boundary of the range while sellers have been unable to force a meaningful rejection, underscoring the constructive nature of the monthly recovery without yet confirming a breakout. The focus now shifts to whether the weekly and monthly closes can provide the confirmation needed to resolve this consolidation heading into August. Battle lines drawn on the AUD/USD weekly technical chart.
Review my latest Weekly Strategy Webinar for an in-depth breakdown of this Aussie setup and more. Join live on Monday’s at 8:30am EST.
Australian Dollar Price Chart – AUD/USD Weekly
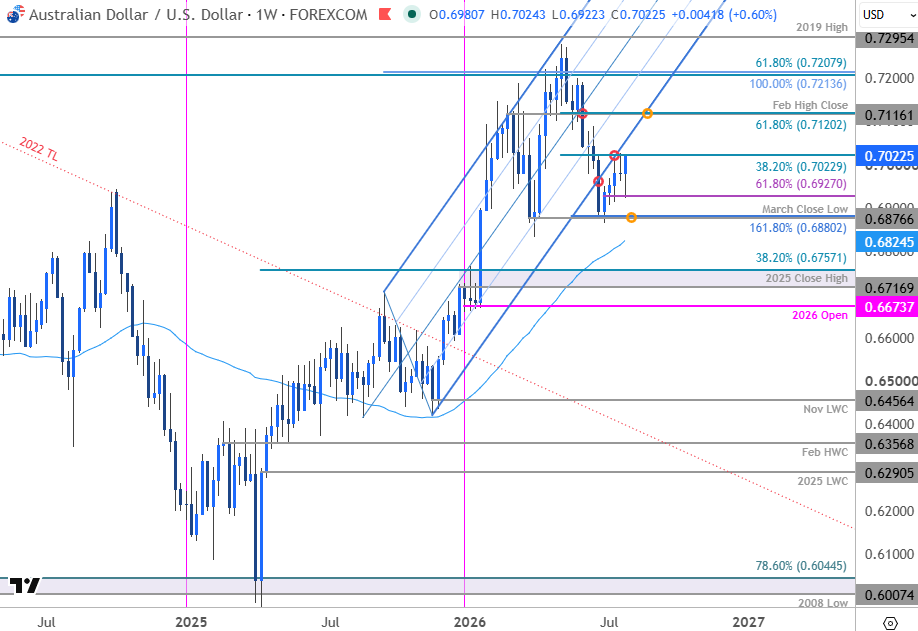
Chart Prepared by Michael Boutros, Sr. Technical Strategist; AUD/USD on TradingView
Technical Outlook: In my last Australian Dollar Forecast we noted that, “AUD/USD has broken the November uptrend with the bears now facing the first major test of technical support. The weekly & monthly opening ranges are taking shape just above and the focus is on a breakout in the days ahead. From a trading standpoint, rallies would need to be limited to 7023 IF price is heading lower on this stretch with a close below 6877 needed to fuel the next major leg of the decline.” Aussie registered an intraday high at 7027 two-weeks later with price stuck in a well-defined range just below resistance for a third week.
Initial support rests with the 61.8% retracement of the late-June advance at 6927 with key support steady at 6877/80- a region define by the March close low and the 1.618% extension of the May decline. A break / weekly close below this threshold would threaten a deeper correction in the weeks ahead with subsequent support seen a the 52-week moving average (currently ~6824) and the 2025 close high / 38.2% retracement of the yearly range at 6717/57.
A topside breach of this key pivot zone would expose key resistance at the February high-close and the 61.8% retracement at 7116/20. Note that former pitchfork support converges on this threshold in mid-August and strength surpassing this slope would suggest a more significant low is place and potential resumption of the broader uptrend. Look for a larger reaction there IF reached. Subsequent resistance objectives are eyed at the 61.8% retracement of the 2021 decline and the 100% extension of the 2025 rally at 7208/14 and the 2019 swing high at 7295.
Bottom line: AUD/USD has rallied four-of-the-past five-weeks (last week marked a weekly doji) with the bulls testing resistance at the monthly high for a third-consecutive week. The immediate focus heading into August is on a breakout of this range for guidance. From a trading standpoint, losses should be limited to 6927 IF price is heading higher on this stretch with a close above 7023 needed to fuel the next leg of the rally.
Keep in mind we get the release of key ISM data next week with the July Non-Farm Payrolls report on tap Friday. Stay nimble into the monthly cross and watch the weekly closes for guidance into the August open. Review my latest Australian Dollar Short-term Outlook for a closer look at the near-term AUD/USD technical trade levels.
Australia / US Economic Calendar
Economic Calendar - latest economic developments and upcoming event risk.
Active Weekly Technical Charts
- Canadian Dollar (USD/CAD)
- S&P 500, Nasdaq, Dow
- Bitcoin (BTC/USD)
- Japanese Yen (USD/JPY)
- Euro (EUR/USD)
- Swiss Franc (USD/CHF)
- Gold (XAU/USD)
- British Pound (GBP/USD)
- US Dollar Index (DXY)
--- Written by Michael Boutros, Senior Technical Strategist
Follow Michael on X @MBForex







Web Trader platform
Our sophisticated web-based platform is packed with features.
Open an account today
Experience award-winning platforms with fast and secure execution.
Economic calendar
Related articles

Euro Short-term Outlook: EUR/USD Pullback Nears Pivotal Uptrend Support 8 28 2026
Warsh's comments accelerated the EUR/USD selloff, raising the stakes as buyers look to stabilize the broader recovery.

EUR/USD forecast: All eyes on Warsh at Jackson Hole - Forex Friday
For much of this week, the EUR/USD has been edging lower with the US dollar regaining some ground after last week’s sell-off that was triggered, in part, by the bond market worries. Investors have been unwilling to bet further against the US dollar so far this week ahead of Kevin Warsh’s keynote speech at the Jackson Hole summit, due later today.


AUD/CAD breakout puts the Bradman barrier in sight
A bullish breakout has pushed AUD/CAD to its highest level since early 2021. Whether it can clear 0.9994 may determine if the move extends well above parity.
