


Bitcoin Price Forecast: BTC/USD Surges 30%—Breakout Rally Faces First Test 5 1 2026
BTC/USD has broken out with the bulls now charging initial resistance targets. The next move could define the strength of this rally.
Written by
Michael Boutros
Sr. Technical Strategist
Bitcoin Technical Forecast: BTC/USD Weekly & Daily Trade Levels
- BTC/USD has surged from the March low, breaking out of a multi-month downtrend.
- The rally is now approaching the first key resistance hurdles following the breakout.
- A hold above former resistance would support continuation of the advance.
- The next move hinges on whether buyers can sustain control at current levels.
Bitcoin has staged a powerful recovery in recent weeks, with BTC/USD breaking out of a multi-month downtrend and establishing a strong upside bias. The move reflects a decisive shift in momentum following the early-year selloff, with price now approaching a key resistance zone that could determine the next phase of the advance. The reaction at this level will be critical in assessing whether the breakout has further room to run or if the rally begins to lose steam. Battle lines drawn on the BTC/USD technical charts heading into May.
Review my latest Weekly Strategy Webinar for an in-depth breakdown of this Bitcoin setup and more. Join live on Monday’s at 8:30am EST.
Bitcoin Price Chart – BTC/USD Weekly
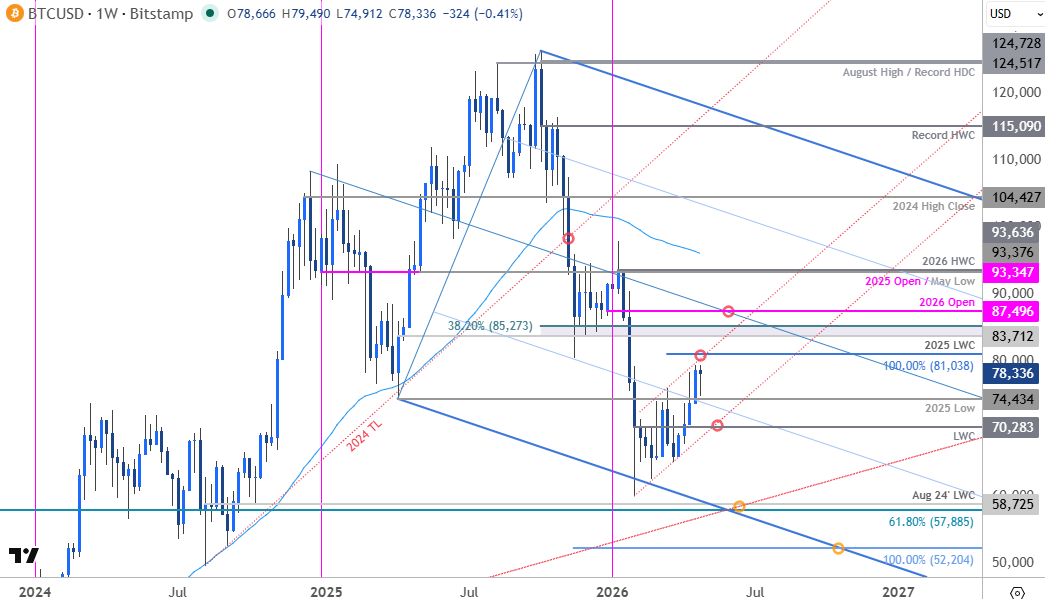
Chart Prepared by Michael Boutros, Sr. Technical Strategist; BTC/USD on TradingView
In my March Bitcoin Forecast we noted that BTC/USD was testing key technical resistance and that, “From a trading standpoint, rallies would need to be limited to 76,159 IF price is heading lower on this stretch with a close below 66,074 needed to fuel the next major leg of the decline.” Bitcoin plunged more than 14.5% off those highs and despite marking a weekly close at 65,954, the bears could not sustain the break. The subsequent rebound has now climbed more than 20% off the March lows with the rally breaking above pivotal resistance last week at the 2025 swing low / low close at 74,434-76,159. Note that the 25% parallel converged on this threshold and the breakout suggests a larger recovery may be underway.
Bitcoin Price Chart – BTC/USD Daily
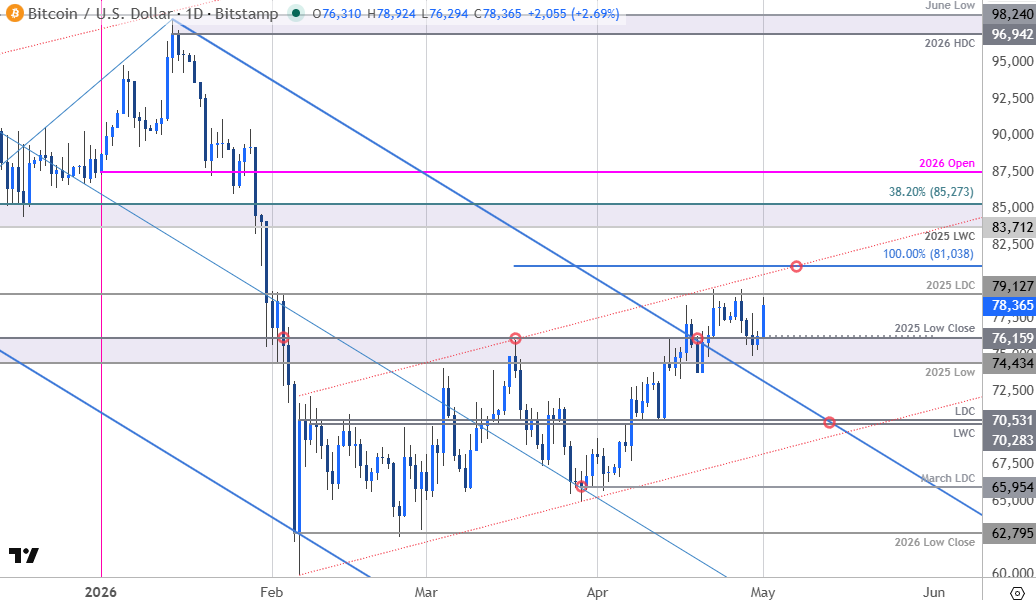
Chart Prepared by Michael Boutros, Sr. Technical Strategist; BTC/USD on TradingView
A closer look at the Bitcoin daily chart shows BTC/USD breaking out of the January pitchfork with an embedded ascending channel guiding the advance off the yearly low. Initial support rests back at the 74,434-76,159 pivot zone with medium-term bullish invalidation now raised to the low-week & low-day closes (LWC / LDC) at 70,283/531. Losses below this threshold would be needed to suggest a more significant high is in place and a larger breakdown is underway. Subsequent support rests at the March low-day close at 65,954 and the yearly low-close at 62,795.
Initial resistance has already been tested twice at the 2025 low-day close at 79,127 and is backed closely by the 100% extension of the February advance at 81,038. Note that channel resistance converges on this threshold in the first half of the month and a breach / weekly close above is needed to fuel the next leg of the advance. Subsequent resistance objectives eyed at the 2025 LWC and the 38.2% retracement of the October decline at 83,712-85,273 and the 2026 yearly open at 87,496.
Bottom line: Bitcoin has rallied more than 31% off the yearly low with BTC/USD breaking out of a multi-month downtrend. The rally is now approaching the first major test of resistance. From a trading standpoint, losses should be limited to 74,434 IF price is heading higher on this stretch with a close above 79,127 needed to fuel a push towards 81,038- look for a larger reaction there IF reached for guidance.
Active Weekly Technical Charts
- British Pound (GBP/USD)
- Canadian Dollar (USD/CAD)
- Gold (XAU/USD)
- Japanese Yen (USD/JPY)
- US Dollar Index (DXY)
- S&P 500, Nasdaq, Dow
- Australian Dollar (AUD/USD)
- Euro (EUR/USD)
- Swiss Franc (USD/CHF)
--- Written by Michael Boutros, Senior Technical Strategist
Follow Michael on X @MBForex







Web Trader platform
Our sophisticated web-based platform is packed with features.
Open an account today
Experience award-winning platforms with fast and secure execution.
Economic calendar
Related articles

Euro Short-term Outlook: EUR/USD Pullback Nears Pivotal Uptrend Support 8 28 2026
Warsh's comments accelerated the EUR/USD selloff, raising the stakes as buyers look to stabilize the broader recovery.

AUD/CAD breakout puts the Bradman barrier in sight
A bullish breakout has pushed AUD/CAD to its highest level since early 2021. Whether it can clear 0.9994 may determine if the move extends well above parity.


Australian Dollar Forecast: AUD/USD Breakout Rally Nears Pivotal Resistance 8 27 2026
Aussie has advanced in eight of the past nine weeks, but the next technical hurdle could determine whether bulls can sustain the broader advance.