


British Pound Forecast: GBP/USD Head-And-Shoulders Could Target Sub-1.33
A confirmed break below 1.3400 would create a bearish head-and-shoulders pattern on GBP/USD and open the door for a drop to below 1.3300 - see why!
Written by
Matt Weller
Head of Market Research
GBP/USD Key Points
- This morning’s initial jobless claims and manufacturing survey data suggests that the US economy continues to chug along at a steady pace.
- Traders continue to push back the perceived probability of an FOMC interest rate cut in Q1, which has fallen to ~20% amidst continued hawkish Fedspeak.
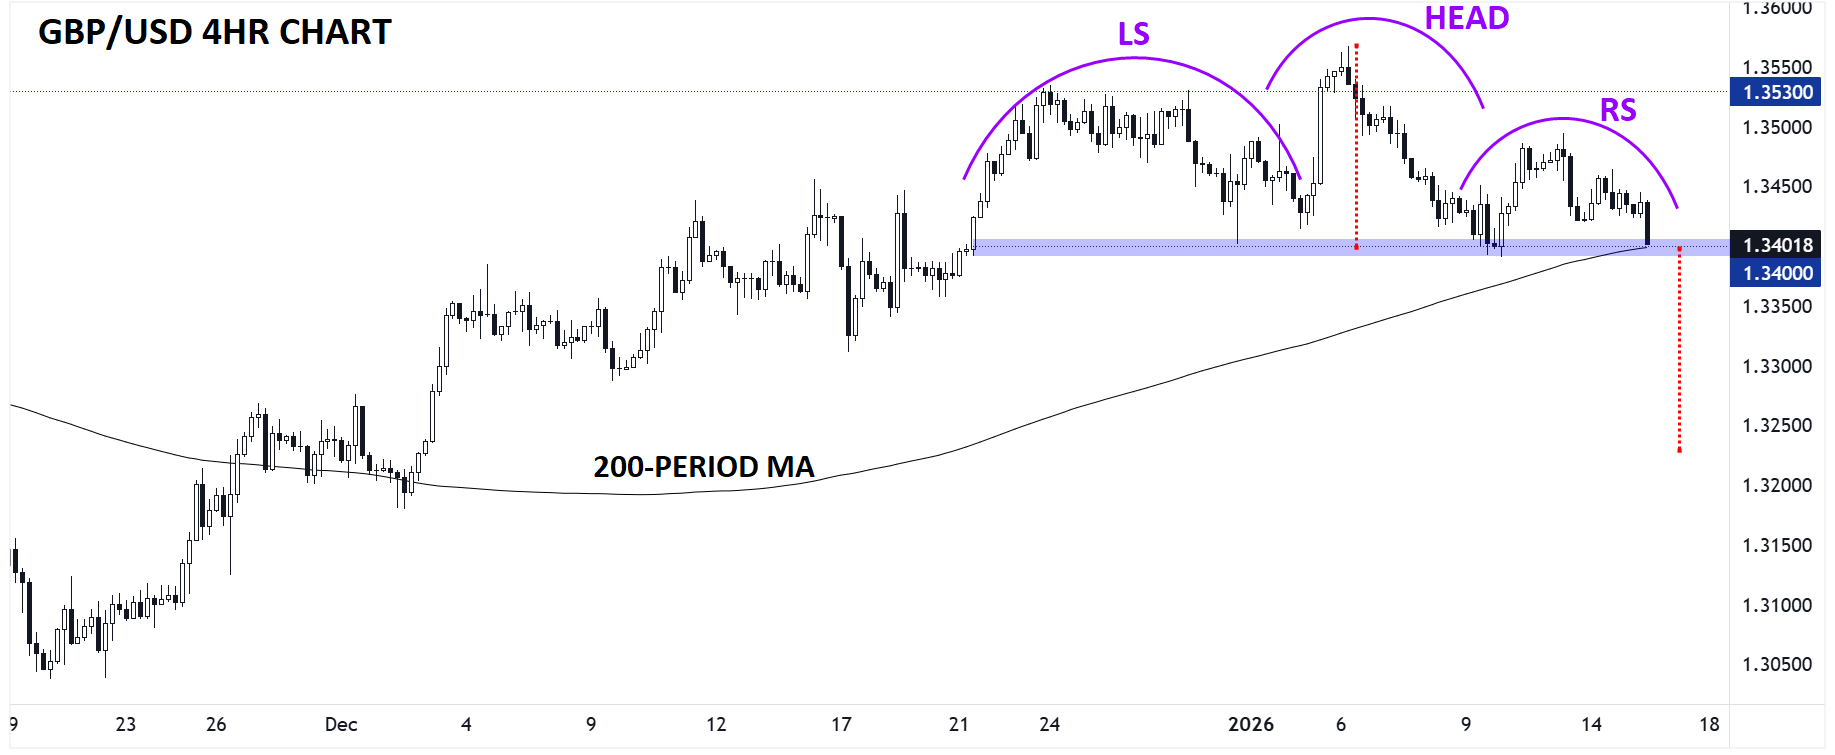
- A confirmed break below 1.3400 would create a bearish head-and-shoulders pattern on GBP/USD and open the door for a drop to below 1.3300.
We’re through most of the first- and second-tier economic data of the week, and the broad takeaway is that the US economy continues to chug along at a steady pace.
This morning’s initial jobless claims report showed fewer than 200K new unemployed Americans, bringing the 4-week moving average of the measure to its lowest level in two years and reinforcing the slow-hire-but-slow-fire labor market in the world’s largest economy. Meanwhile, both the Empire State (7.7) and Philly Fed (12.6) manufacturing indices beat expectations. Accordingly, we’ve seen traders continue to push back the perceived probability of an FOMC interest rate cut in Q1, which has fallen to ~20% amidst continued hawkish Fedspeak:
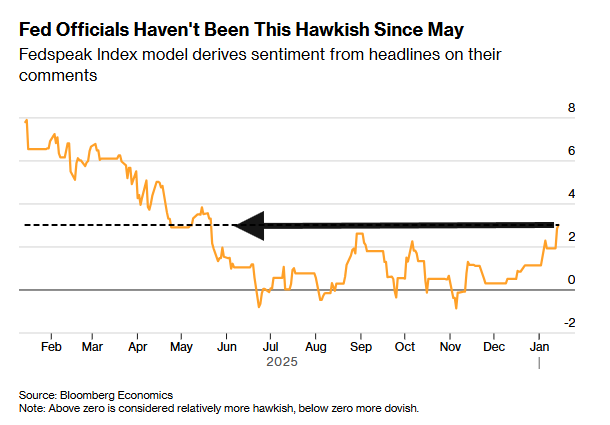
Source: Bloomberg Economics
With geopolitical concerns around US intervention in Iran and/or Greenland fading slightly (for now), traders are back to focusing on economic data, and the picture there continues to point to solid-if-unspectacular growth in the US and ongoing strength in the greenback.

British Pound Technical Analysis: GBP/USD Daily Chart
Source: Tradingview, StoneX
On the other side of the Atlantic, the UK reported November’s GDP reading, which came in better-than-expected at 0.3% m/m vs. 0.1% anticipated. Despite the ostensibly decent data, the pound has been unable to hold a bid and is actually the weakest major currency on the day.
As many experienced traders know, one of the strongest signals you can get is when a market fails to rally on strong data, hinting that the upside is already priced in and the path of least resistance remains to the downside. Looking at the chart above, GBP/USD has carved out a clear Head-and-Shoulders pattern on the 4-hour chart. This pattern shows a shift from an uptrend (higher highs and higher lows) to a downtrend (lower highs and lower lows) and is often seen at notable tops.
With a confirmed break below the neckline at 1.3400 – a level we’re trading just below as we go to press – the pattern would be confirmed, projecting a “measured move” objective equal to the height of the pattern, or about 150 pips, to below 1.3300. The confluence of the 200-period MA on the 4-hour and the 200-day MA (not shown) near this same level reinforces the significance of a potential breakdown.
Geopolitical concerns could easily storm back to the top of traders’ Bloomberg terminals at any point, but from a purely technical and fundamental perspective, there’s a convincing technical and fundamental argument that the path of least resistance for GBP/USD remains to the downside for now.
-- Written by Matt Weller, Global Head of Research
Check out Matt’s Daily Market Update videos on YouTube and be sure to follow Matt on Twitter: @MWellerFX







Web Trader platform
Our sophisticated web-based platform is packed with features.
Open an account today
Experience award-winning platforms with fast and secure execution.
Economic calendar
Related articles

Euro Short-term Outlook: EUR/USD Pullback Nears Pivotal Uptrend Support 8 28 2026
Warsh's comments accelerated the EUR/USD selloff, raising the stakes as buyers look to stabilize the broader recovery.


EUR/USD forecast: All eyes on Warsh at Jackson Hole - Forex Friday
For much of this week, the EUR/USD has been edging lower with the US dollar regaining some ground after last week’s sell-off that was triggered, in part, by the bond market worries. Investors have been unwilling to bet further against the US dollar so far this week ahead of Kevin Warsh’s keynote speech at the Jackson Hole summit, due later today.


AUD/CAD breakout puts the Bradman barrier in sight
A bullish breakout has pushed AUD/CAD to its highest level since early 2021. Whether it can clear 0.9994 may determine if the move extends well above parity.
