


Crude Oil Price Forecast: WTI and Brent Pull Back as US-Iran Negotiations Resume
Middle East ceasefire negotiations and key technical resistance levels triggered a correction in crude oil prices after last week's surge above $90 per barrel. However, geopolitical risk premiums remain firmly embedded in the market.
Written by
Razan Hilal
Market Analyst
Middle East ceasefire negotiations and key technical resistance levels triggered a correction in crude oil prices after last week's surge above $90 per barrel. However, geopolitical risk premiums remain firmly embedded in the market.
While the latest pause in military strikes has reduced immediate escalation concerns, investors continue to monitor several unresolved issues that could quickly revive volatility, including:
- Control and transit rules through the Strait of Hormuz
- Security guarantees for commercial shipping
- The long-term framework surrounding Iran's nuclear program and potential sanctions relief
From a technical perspective, both WTI and Brent have retreated back toward the boundaries of the March–June consolidation range that preceded July's breakout.
- WTI reversed below the $93 resistance, which also coincides with the March–June descending trendline resistance.
- Brent also turned lower after testing the upper boundary of its consolidation structure.
Despite the recent pullback, broader market positioning suggests that geopolitical risk premiums remain elevated.
This is reflected by:
- The US Dollar Index (DXY) holding above the 101 level.
- USD/JPY remaining above 163.
- US equity indices continuing to consolidate near the bearish edge of their recent ranges.
- Gold and silver remaining capped below major resistance levels around 4,200 and 61, respectively.
The focus is no longer solely on developments surrounding the US-Iran conflict. Markets are also preparing for the upcoming Federal Reserve meeting, where concerns remain that policymakers could adopt a more hawkish tone given the renewed supply chain disruption risks stemming from higher energy prices.
As a result, attention is shifting toward measuring the downside potential in crude oil while identifying key technical levels where renewed geopolitical escalation—or further unwinding of risk premiums—could reverse price action.
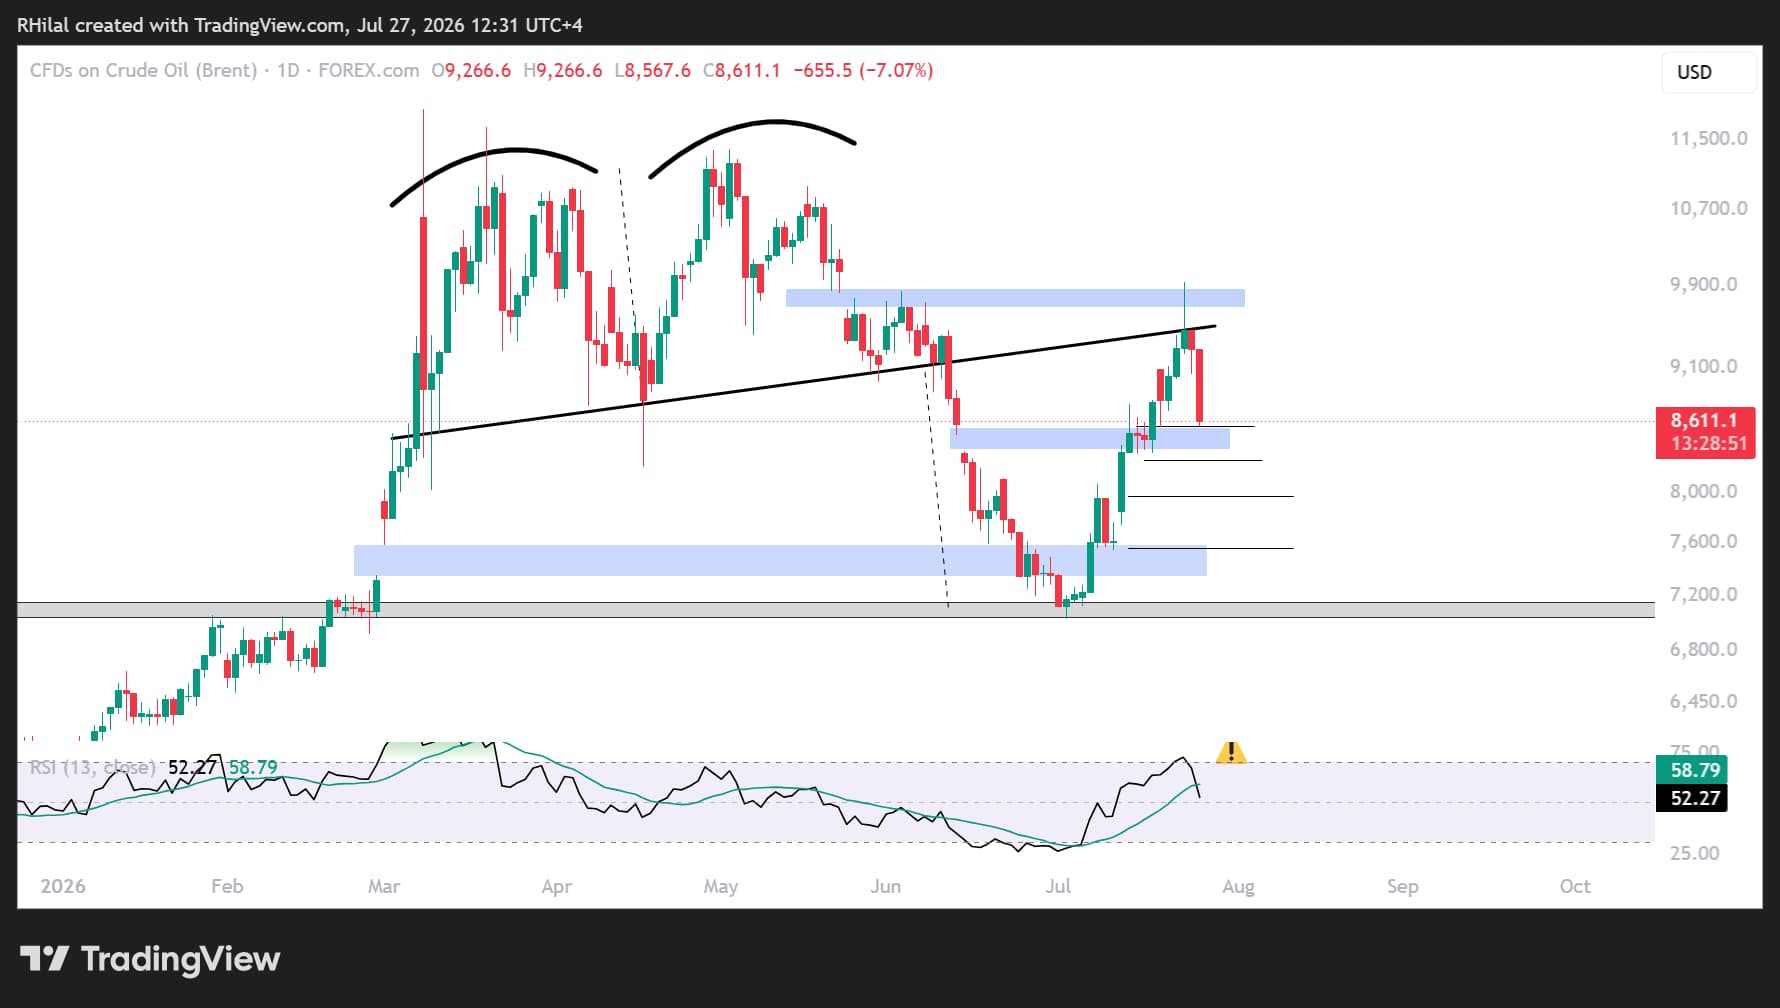
Brent Technical Analysis – Daily Chart (Log Scale)
Source: TradingView
Brent crude is currently pulling back below the neckline of its March–June double-top formation, reinforcing the near-term bearish technical outlook.
Price is now retesting the upper boundary of the previous running gap near $86, a level that also aligns with the 38.2% Fibonacci retracement of July's rally.
Bullish Scenario
Holding above the $86 support zone would stabilize the broader uptrend and could pave the way for another test of the neckline resistance near $95.
A confirmed breakout above this level would expose new yearly highs while reinforcing concerns over persistent inflationary pressures and renewed stagflation risks heading into year-end.
Bearish Scenario
A decisive break below $86 would increase the probability of a deeper correction as geopolitical risk premiums unwind.
The next downside objectives are:
- $82.50 (50% Fibonacci retracement)
- $79 (61.8% Fibonacci retracement)
A sustained move below these levels would shift the medium-term outlook toward a broader bearish trend.
The Bigger Picture
Markets remain deeply interconnected.
Supply chain disruptions that push crude oil prices higher continue to ripple across financial markets, reinforcing inflation expectations, lifting Treasury yields, supporting the US dollar, and increasing the likelihood of a more hawkish monetary policy stance—even as recent inflation data have shown continued disinflation and corporate earnings have generally exceeded expectations.
Understanding this chain reaction remains essential for assessing not only crude oil, but also the broader macroeconomic landscape.
I explain this longer-term geopolitical framework and potential rhyming patterns from the previous energy shock in my latest article: Crude Oil Outlook: What the 1973 Oil Embargo Tells Us About the 2026 Hormuz Crisis
Written by Razan Hilal, CMT
Follow on X: @Rh_waves







Web Trader platform
Our sophisticated web-based platform is packed with features.
Open an account today
Experience award-winning platforms with fast and secure execution.
Economic calendar
Related articles

Canadian Dollar Forecast: USD/CAD Weekly Reversal Puts Yearly Uptrend Back in Focus 8 29 2026
USD/CAD has staged its strongest weekly advance since June, shifting the focus to whether a more durable low is finally taking shape.


USD/JPY weekly outlook: Payrolls may challenge the Fed’s hawkish reset
USD/JPY has finally woken from its slumber. Payrolls now loom as the key test of whether the latest hawkish repricing sticks or sinks.


Euro Short-term Outlook: EUR/USD Pullback Nears Pivotal Uptrend Support 8 28 2026
Warsh's comments accelerated the EUR/USD selloff, raising the stakes as buyers look to stabilize the broader recovery.