


Crude Oil Weekly Outlook: Is Russia the Next Risk Premium for Oil Prices?
Crude Oil Weekly Outlook: Will attacks on Russian energy infrastructure offset oversupply risks? Key support, resistance, and price scenarios for oil this week.
Written by
Razan Hilal
Market Analyst
Crude oil prices have largely unwound the geopolitical premium built during the Middle East conflict, returning close to pre-conflict levels. While the broader trend remains bearish due to oversupply concerns, oversold technical conditions and renewed attacks on Russian energy infrastructure could trigger a short-term rebound. Here are the key scenarios to watch this week.
Crude oil markets remain focused on fading geopolitical risks and growing supply surplus expectations heading into year-end. As shipping through the Strait of Hormuz normalizes, inventories recover from an 8-million-barrel draw to approximately a 3-million-barrel draw, Gulf exports resume, and OPEC+ continues increasing production, adding another 188,000 barrels per day in July, the market is increasingly pricing in abundant supply.
However, an emerging risk has begun attracting attention.
Extended attacks on Russian energy infrastructure and oil refineries have created localized supply shortages within Russia, raising questions about potential disruptions to refined product availability and exports if attacks intensify. According to Reuters, refinery disruptions have, at times, reduced Russian refining activity by nearly 20%, contributing to domestic fuel supply stress.
Meanwhile, crude oil has declined more than 40% from its 2026 highs, leaving daily momentum indicators in oversold territory. While this supports the case for a short-term rebound, a sustained return toward this year's highs would likely require a fresh geopolitical catalyst, such as:
- Renewed disruptions to Strait of Hormuz shipping.
- Material damage to major Russian export terminals.
- Black Sea shipping disruptions.
- Large-scale production outages.
- New sanctions that materially reduce Russian exports.
Conversely, if oversupply risks continue to build and global demand weakens further—particularly from China—the bearish outlook could strengthen. The International Energy Agency (IEA) expects global oil demand growth to slow to around 1.1 million barrels per day this year. Under that scenario, crude prices could gradually realign with the $55 area, consistent with my second-half 2026 crude oil outlook. Crude Oil Price Forecast H2 2026: Will Oversupply Push WTI Back to $55?
I also discuss the latest crude oil technical outlook in my daily MENA Market Call.
Register here to join the next session.
Another headwind for oil remains lingering stagflation concerns following the Middle East conflict. Slower global growth alongside persistent inflation pressures could continue weighing on energy demand.
The latest US Non-Farm Payrolls report reinforced those concerns, with job creation slowing sharply from 129,000 to 57,000. While part of the weakness may prove seasonal, it remains an important indicator to monitor as softer labour markets could eventually translate into weaker oil demand if economic activity continues to cool.
Crude Oil Weekly Outlook: Weekly Time Frame – Log Scale
Source: Trading view
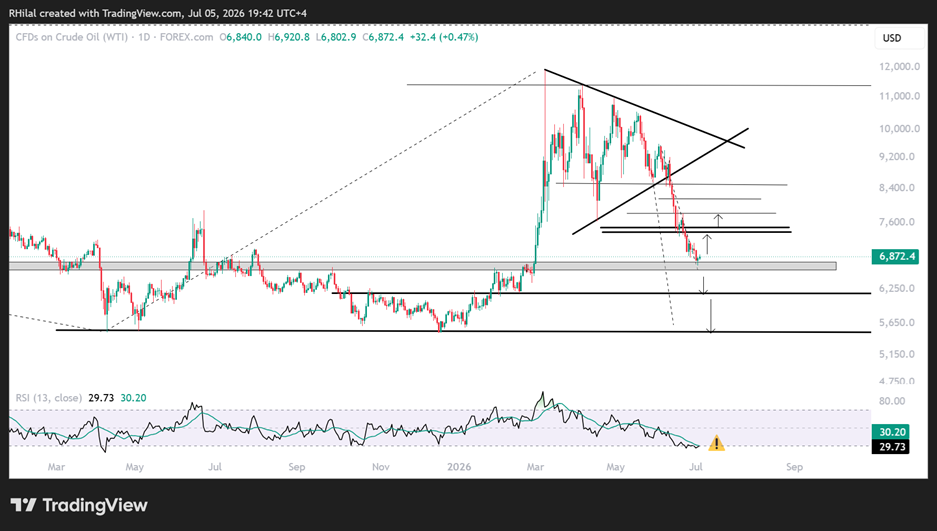
WTI crude oil continues to hold above the $66.50 area, a critical technical support that presents near-term rebound risks. This level aligns with:
- Multi-year support dating back to 2019.
- The 78.6% Fibonacci retracement of the 2026 rally.
- Oversold daily momentum conditions last seen in 2025, when crude traded near the $55 low.
- Renewed geopolitical risks surrounding Russian energy infrastructure.
Key Resistance Levels
Should the rebound extend, the following resistance levels will be closely watched:
- $73.50 – 23.6% Fibonacci retracement of the June–July decline.
- $74.60 – 27.2% Fibonacci retracement.
- $77.80 – 38.2% Fibonacci retracement (high-probability pullback zone).
- $81.20 – 50% Fibonacci retracement.
- $84.80–85.00 – 61.8% Fibonacci retracement (high-probability pullback zone).
Key Support Levels
The broader bearish trend remains intact following the breakdown below the March–June consolidation range.
If $66 fails to hold, downside pressure could initially target the $61 support area before any meaningful rebound develops. A decisive break below $61 would strengthen the case for an eventual move toward the $55 objective outlined in my second-half outlook.
Despite the potential for a near-term technical recovery from oversold conditions, the medium-term trend remains biased to the downside unless a new geopolitical catalyst significantly alters the global supply outlook.
Written by Razan Hilal, CMT
Follow on X: @Rh_waves







Web Trader platform
Our sophisticated web-based platform is packed with features.
Open an account today
Experience award-winning platforms with fast and secure execution.
Economic calendar
Related articles

Canadian Dollar Forecast: USD/CAD Weekly Reversal Puts Yearly Uptrend Back in Focus 8 29 2026
USD/CAD has staged its strongest weekly advance since June, shifting the focus to whether a more durable low is finally taking shape.


USD/JPY weekly outlook: Payrolls may challenge the Fed’s hawkish reset
USD/JPY has finally woken from its slumber. Payrolls now loom as the key test of whether the latest hawkish repricing sticks or sinks.


Euro Short-term Outlook: EUR/USD Pullback Nears Pivotal Uptrend Support 8 28 2026
Warsh's comments accelerated the EUR/USD selloff, raising the stakes as buyers look to stabilize the broader recovery.