


Crude Oil Weekly Outlook: Tight Inventories Keep Bulls in Control
Crude Oil Weekly Outlook: WTI crude oil remains supported above $80 as US inventories fall near yearly lows. Explore key technical levels and scenarios guiding oil prices.
Written by
Razan Hilal
Market Analyst
WTI crude oil continues to hold a bullish bias above $80 per barrel as tightening supply conditions and persistent geopolitical risks keep the market's risk premium firmly in place. Falling US crude inventories and unresolved security concerns across key global shipping routes remain the dominant drivers heading into the week ahead.
Key themes in focus
- US crude inventories fell back near yearly lows, declining by 7.2 million barrels during the peak summer demand season.
- Persistent security risks across the Strait of Hormuz and Bab el-Mandeb/Red Sea continue supporting the geopolitical risk premium.
- While seasonal inventory drawdowns are common during the summer driving season, this year's decline stands out because it is occurring alongside prolonged geopolitical disruptions that continue to threaten global energy supply chains.
- The market's primary focus remains whether a lasting geopolitical resolution can restore confidence in maritime security or whether current disruptions continue supporting elevated oil prices. Crude Oil Outlook: What the 1973 Oil Embargo Tells Us About the 2026 Hormuz Crisis
- Next week's US Nonfarm Payrolls (NFP) report is expected to be the primary macro catalyst alongside developments in the Middle East.
Crude Oil Weekly Outlook: Daily Time Frame – Log Scale
Source: TradingView
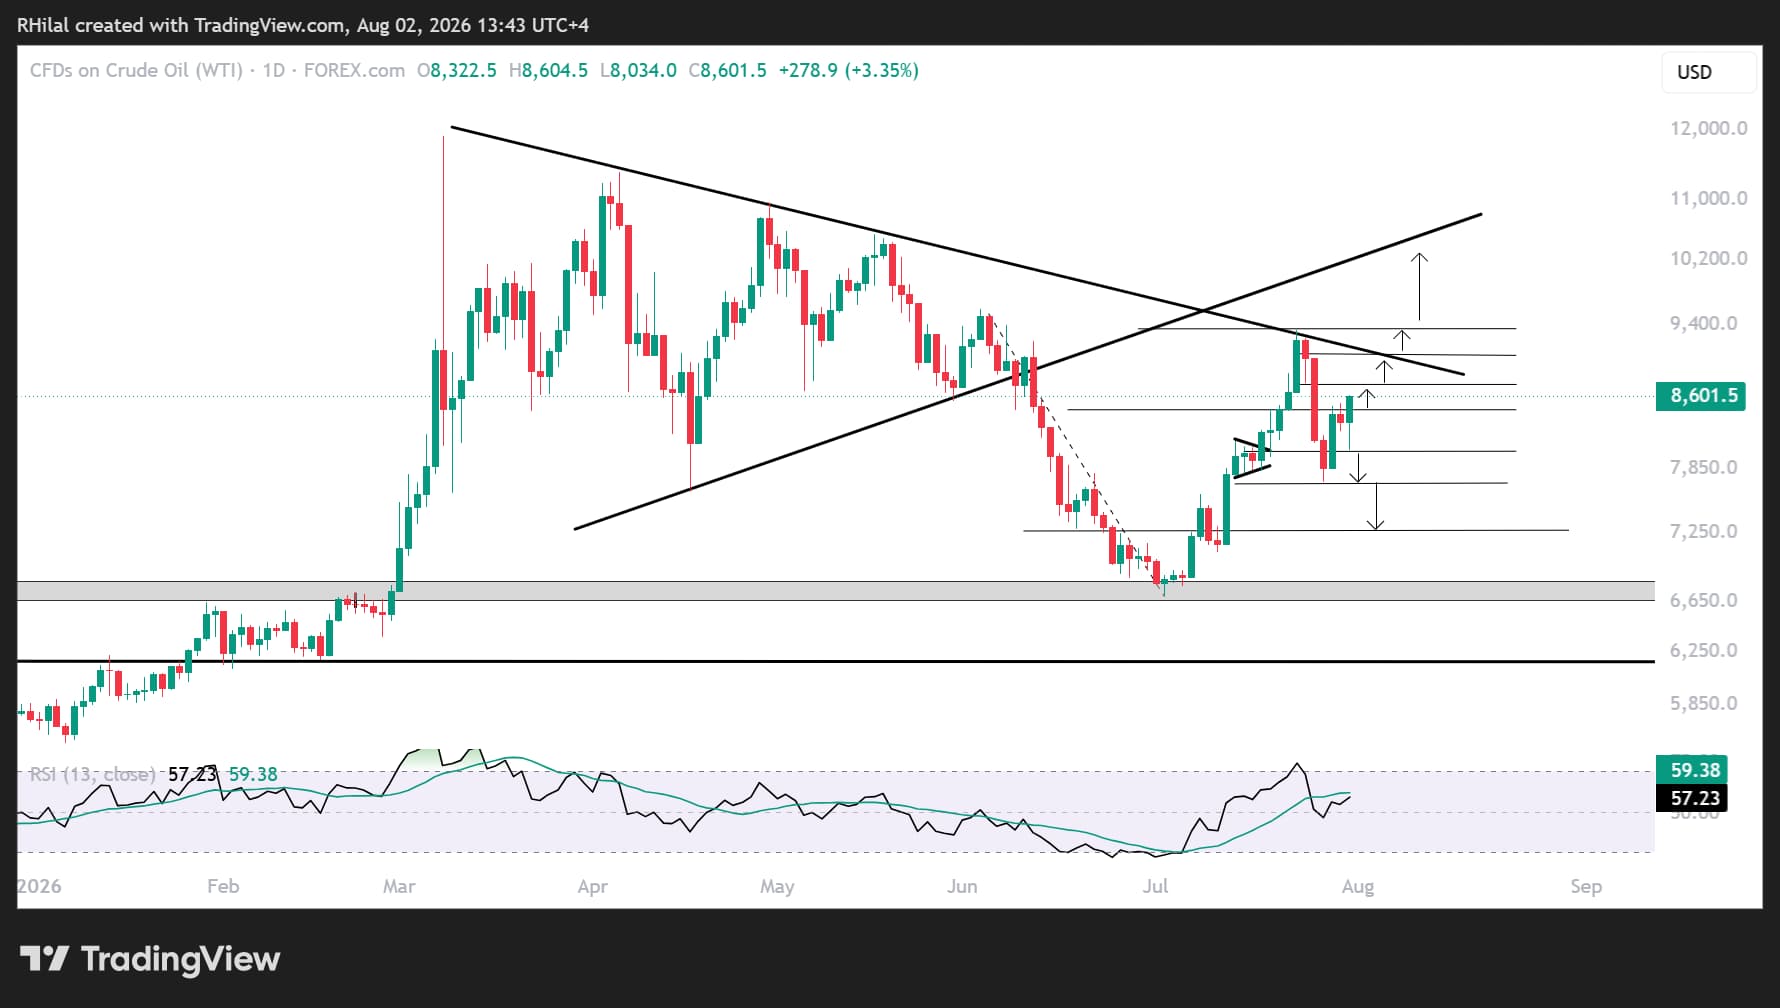
WTI crude oil's latest pullback found support at $77, corresponding to the 61.8% Fibonacci retracement of July's advance. Persistent US-Iran tensions and another sharp decline in US crude inventories helped stabilize prices above that level.
Price action continues to hold above $81, reinforcing the broader bullish structure. A sustained move above $86 would expose the next Fibonacci extension levels from July's advance:
- $87.40 – 50% Fibonacci extension.
- $93.70 – 61.8% Fibonacci extension and a high-probability profit-taking zone. A sustained breakout above this area would significantly increase the risk of renewed geopolitical escalation, stronger inflationary pressures, and rising stagflation concerns. This level also aligns with the descending resistance trendline that has guided price action since March 2026.
- $104.00 – 100% Fibonacci extension, aligning with the former March-June consolidation support that may now act as major resistance.
Such a move would likely coincide with:
- Persistent Middle East tensions.
- Continued upside pressure on Treasury yields.
Bearish Scenario
Should crude oil fall back below $80, attention would immediately shift to the $77 support zone.
A sustained break beneath that level would expose the critical $72 and 66.50 support region.
This area continues to define the broader escalation versus de-escalation narrative for 2026, having repeatedly acted as both support and resistance since 2019, as discussed in my recent video.
A weekly close below $66.50 would expose the 2026 lows near $55, suggesting markets are beginning to price a longer-term geopolitical de-escalation scenario. Such a development would likely support broader risk appetite across financial markets while easing inflationary pressures.
Written by Razan Hilal, CMT
Follow on X: @Rh_waves







Web Trader platform
Our sophisticated web-based platform is packed with features.
Open an account today
Experience award-winning platforms with fast and secure execution.
Economic calendar
Related articles

Euro Short-term Outlook: EUR/USD Pullback Nears Pivotal Uptrend Support 8 28 2026
Warsh's comments accelerated the EUR/USD selloff, raising the stakes as buyers look to stabilize the broader recovery.


AUD/CAD breakout puts the Bradman barrier in sight
A bullish breakout has pushed AUD/CAD to its highest level since early 2021. Whether it can clear 0.9994 may determine if the move extends well above parity.


Australian Dollar Forecast: AUD/USD Breakout Rally Nears Pivotal Resistance 8 27 2026
Aussie has advanced in eight of the past nine weeks, but the next technical hurdle could determine whether bulls can sustain the broader advance.