


Crypto Technical Analysis Can the bearish pressure slow down?
As markets move into the final stretch of June, one of the main factors still shaping the major cryptocurrency market is the significant weakness that has remained in place for several weeks. The latest week was no exception, as most of the crypto market posted relevant losses and new lows, including Bitcoin, which fell below the 60k area and reached a new low for the year.
Written by
Julian Pineda
Market Analyst
As markets move into the final stretch of June, one of the main factors still shaping the major cryptocurrency market is the significant weakness that has remained in place for several weeks. The latest week was no exception, as most of the crypto market posted relevant losses and new lows, including Bitcoin, which fell below the 60k area and reached a new low for the year.
The lack of demand strength is becoming increasingly clear. Recent market behavior shows that selling pressure remains dominant in the short term, meaning this dynamic could continue to weigh on prices over the next few trading sessions.

Performance of the main cryptocurrencies
Source: Data - StoneX, Tradingview
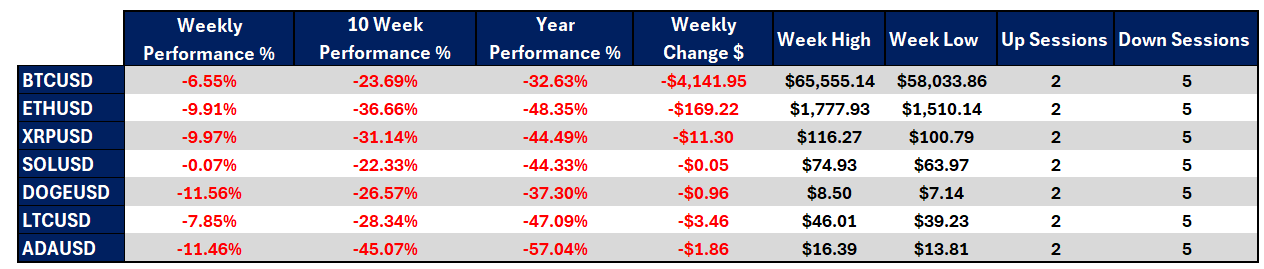
- During the week, consistent weakness once again became evident across the main cryptocurrencies. None of them managed to sustain relevant recovery moves in the short term. Dogecoin and Cardano stood out, losing more than 11% during the week and becoming the most sensitive cryptocurrencies in the group. The only one that managed to maintain some stability was Solana, whose weekly moves showed only a 0.07% decline. For now, it is the only cryptocurrency in the group that has not posted a significant loss in value.
- Looking at the average performance over the last 10 weeks, significant weakness continues to stand out across the main cryptocurrencies, and this dynamic is becoming increasingly evident. All of them continue to show relevant losses, which suggests that medium-term selling pressure has not fully disappeared and could remain important over the coming weeks. In this scenario, Cardano remains the most affected cryptocurrency, with a loss of 45.07%, while Bitcoin has tried to show greater relative stability, falling 23.69%. Even so, medium-term weakness remains clear and shows that the recent recovery has not been enough to improve the accumulated dynamic of recent months.
- So far this year, the market still faces an important challenge, as none of the main cryptocurrencies has managed to move above its 2026 opening price. In fact, most of them remain increasingly far from those levels. Cardano continues to be the weakest asset in this period, with a decline of 57.04%, partly because it was also one of the most affected cryptocurrencies in the short term during the latest week. This reflects a particularly difficult environment for confidence in this asset. Meanwhile, Bitcoin has tried to maintain better relative stability, with a decline of 32.63%. Overall, the crypto market continues to accumulate a significant negative performance in 2026.
- Bitcoin, as the market’s main reference, continues to show relevant weakness. During the week, it lost more than 4,000 dollars in value and reached a new low around 58k, its lowest price of 2026. This behavior reinforces the bearish pressure that continues to affect the leading cryptocurrency.
- Overall, most of the market continues to show a clear weakness bias, which has led to new short-term lows. This dynamic could remain relevant over the next few sessions, especially if important barriers across the crypto market continue to break.
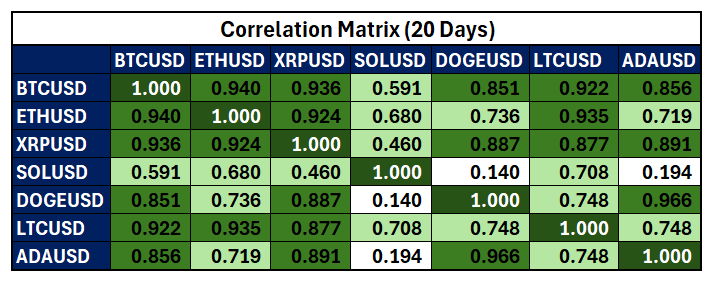
Red-to-green colors – Red for negative correlations and green for positive correlations
Source: Data - StoneX, Tradingview
From a correlation perspective, a positive relationship still stands out between the movements of the main cryptocurrencies and Bitcoin. Now, most correlation coefficients remain close to 0.9, reflecting an important relationship between Bitcoin’s movements and the rest of the market over the last 20 sessions. However, the only cryptocurrency that has partially moved away from this dynamic is Solana, with a coefficient close to 0.6, showing some loss of correlation with Bitcoin in the short term. It is important to remember that correlation coefficients can change over time.
This behavior shows that the crypto market, in general, remains closely tied to Bitcoin’s dynamic. As long as the reference cryptocurrency fails to recover confidence, selling pressure could remain present across a large part of the sector over the next few trading sessions. Solana is the only one that, for now, has tried to resist the recent weakness better, although the lack of appeal in the crypto market remains evident.
Bitcoin hits new lows for the year
Source: StoneX, Tradingview
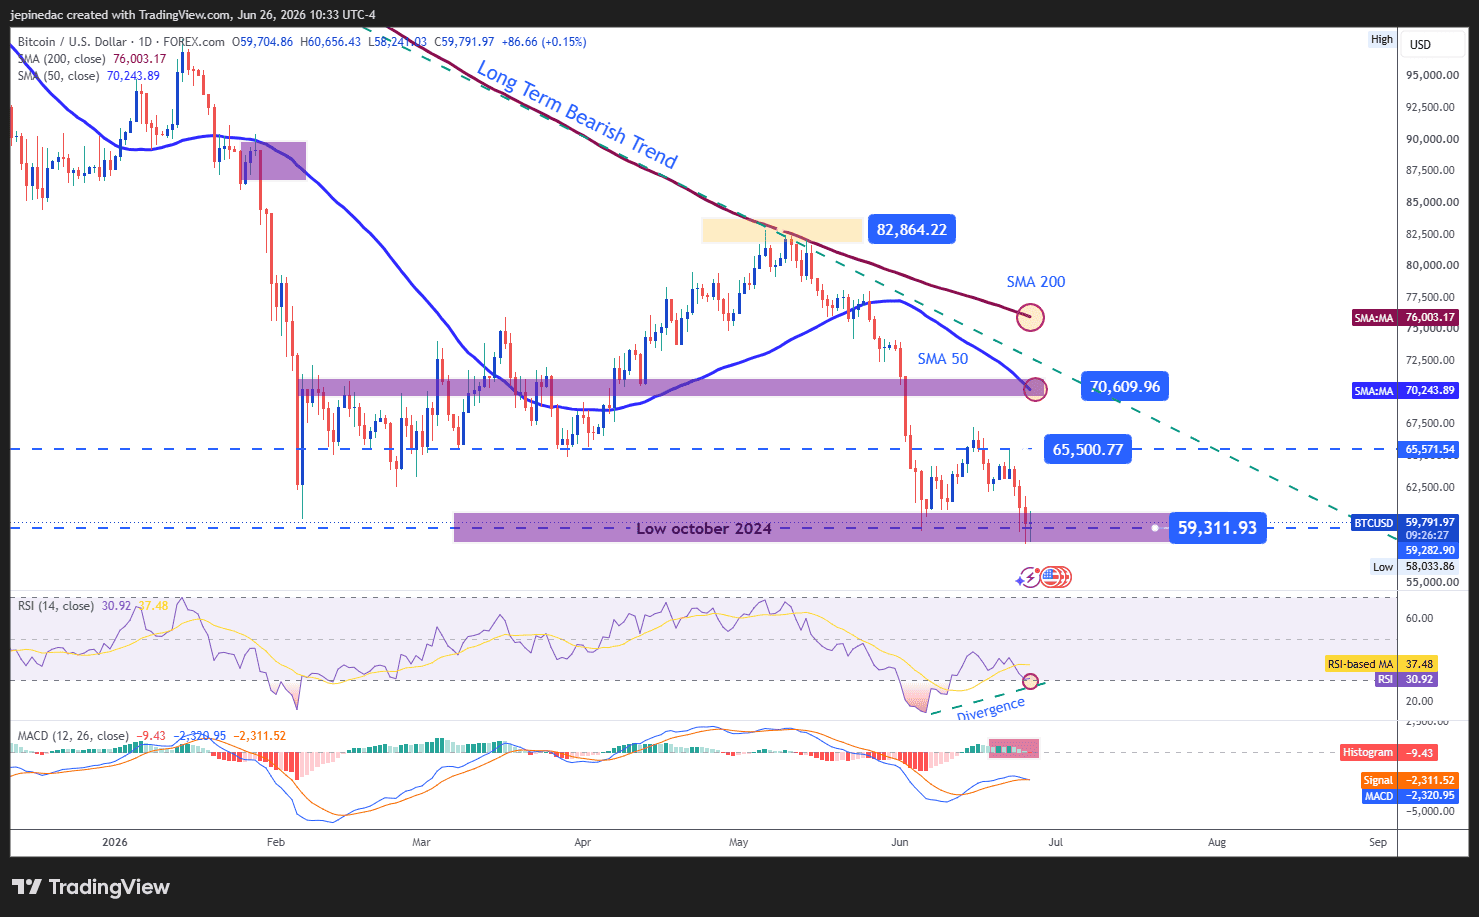
Bitcoin, as the main reference for the crypto market, has not managed to recover the confidence needed in the short term and continues to show weak price action within a large bearish trendline, which has remained the dominant technical pattern for several months. With no relevant bullish corrections so far, the selling bias continues to dominate the market. As important psychological levels continue to break, the bearish trend could remain the main structure over the next few sessions. However, given the recent acceleration in the price decline, there could also be some room for mild short-term bullish corrections.
Indicators:
- Now, the RSI continues to move below the 50 neutral line, while the MACD histogram is preparing to cross below the 0 line. Both indicators suggest that the market’s average strength and momentum continue to favor a selling bias on the chart. However, Bitcoin’s price is also forming lower lows, while the RSI is forming higher lows. This suggests a possible bullish divergence, reflecting a recent excess of selling pressure that could open the door to short-term bullish corrections.
Key levels:
- 70,600 USD – Important resistance: Recent high area that stands as the most relevant upside barrier to watch and coincides with the 50-period moving average. Price moves toward this level could reactivate a buying bias that has lost strength and start to put the bearish trendline at risk over the coming weeks.
- 65,500 USD – Nearby barrier: Recent neutrality level that previously acted as a low area on the chart. This point could work as a tentative barrier if bullish corrections begin to appear over the next few trading sessions.
- 59,300 USD – Definitive support: This area represents the October 2024 low and is close to important psychological levels, making it the key downside barrier to watch. Consistent moves below this point could reinforce the selling bias and extend the bearish trendline as the main price structure over the following weeks.
Solana is the only one showing stability
Source: StoneX, Tradingview
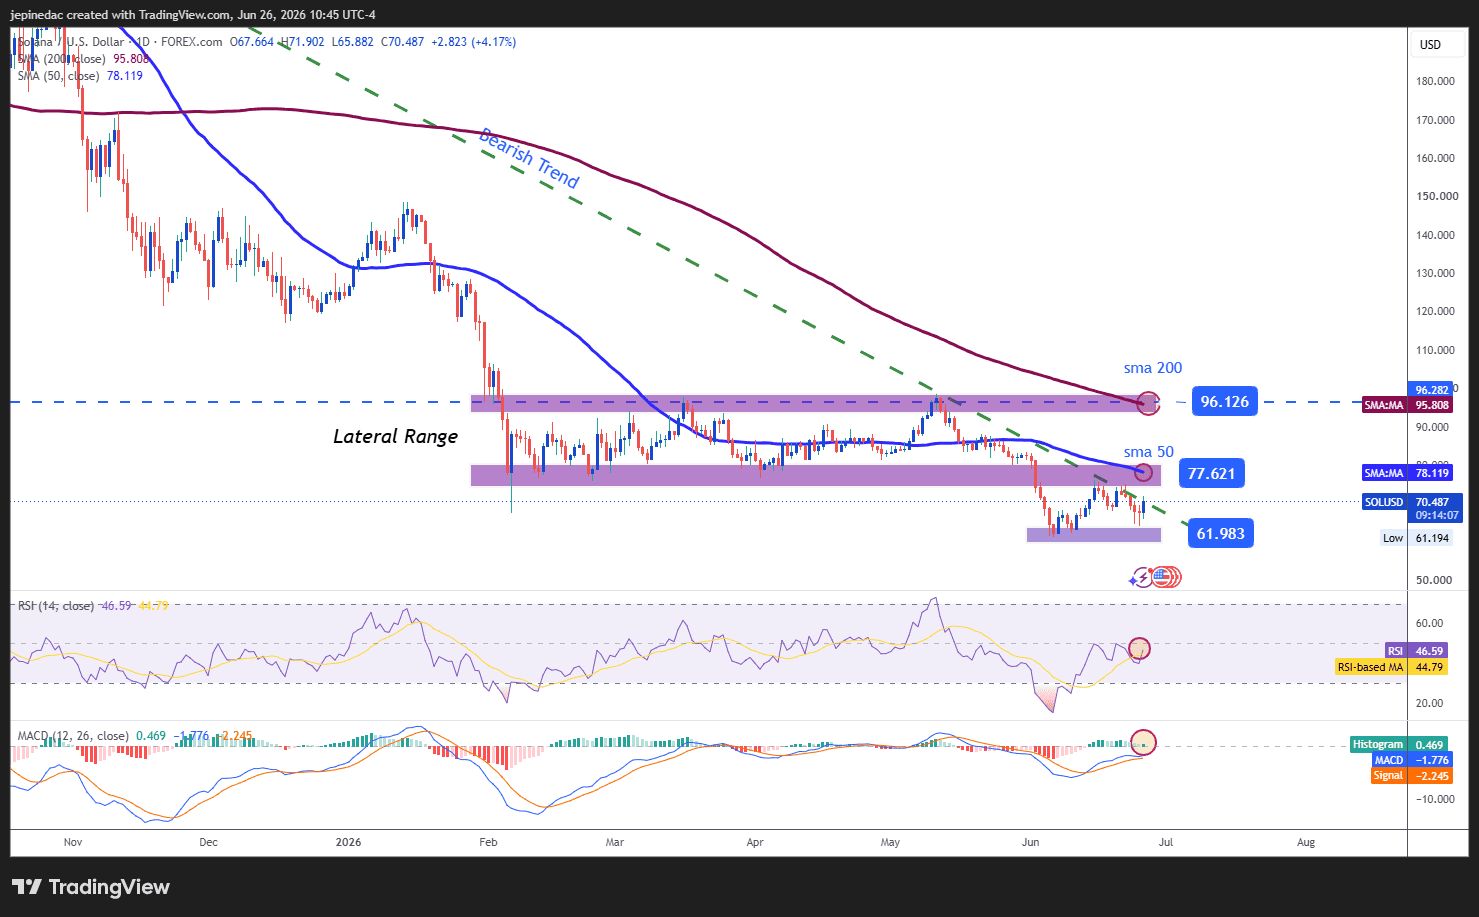
Solana stood out during the latest trading week as the only cryptocurrency that did not lose significant value in the short term. Its price action continues to battle a large long-term bearish trendline, although its recent stability shows that there is still some resistance in the price. If potential buying pressure manages to hold consistently, the long-term bearish trendline could start to come under pressure, opening the door to a clearer buying bias over the next few sessions.
Indicators:
- Now, both the RSI and the MACD histogram remain close to their neutral levels of 50 and 0, respectively. This suggests that the strength of moving averages and market impulses remains balanced, which may also reflect an important phase of indecision in Solana’s price action over the next few trading sessions.
Key levels:
- 96.12 – Important resistance: Relevant high area from recent weeks, which coincides with the 200-period moving average. Price moves toward this point could mark the end of the long-term bearish trendline and open the door to the possible formation of a dominant buying bias over the following weeks.
- 77.62 – Nearby barrier: Relevant neutrality level that coincides with the 50-period moving average. If price remains too close to this level, a clearer phase of indecision could start to build and give way to a sideways range over the next few sessions.
- 61.98 – Main support: This level corresponds to the relevant 2026 low area and stands as the most important downside barrier to watch. Moves below this level could bring dominant selling pressure back into focus and generate an important extension of the bearish trendline over the coming weeks.
Written by Julian Pineda, CFA, CMT – Market Analyst
Follow him on: @julianpineda25







Web Trader platform
Our sophisticated web-based platform is packed with features.
Open an account today
Experience award-winning platforms with fast and secure execution.
Economic calendar
Related articles

Bitcoin Forecast: BTC/USD Back to $80K Ahead of Warsh’s Jackson Hole Speech
After surging over $15,000 in the past 10 days alone, there is risk of a near-term pullback if Warsh says anything remotely hawkish at Jackson Hole - what are the levels to watch from here?


Bitcoin’s failed breakouts are becoming hard to ignore
Three failed breakout attempts and fading momentum have put Bitcoin bulls on notice. Another rejection could open the door lower just as attention swings back towards NVIDIA and the AI trade.


US Dollar, Gold & Bitcoin Weekly Technical Outlook 8 24 2026
Key levels on active technical setups in DXY, Gold, and Bitcoin heading into the start of the week.
