


DXY, EUR/USD, AUD/USD Weekly Technical Outlook 7 27 2026
Sr. Technical Strategist Michael Boutros highlights the levels that matter on the USD Majors this week.
Written by
Michael Boutros
Sr. Technical Strategist
Weekly Technical Trade Levels on DXY, EUR/USD & AUD/USD
US Dollar Index Price Chart – USD Daily (DXY)
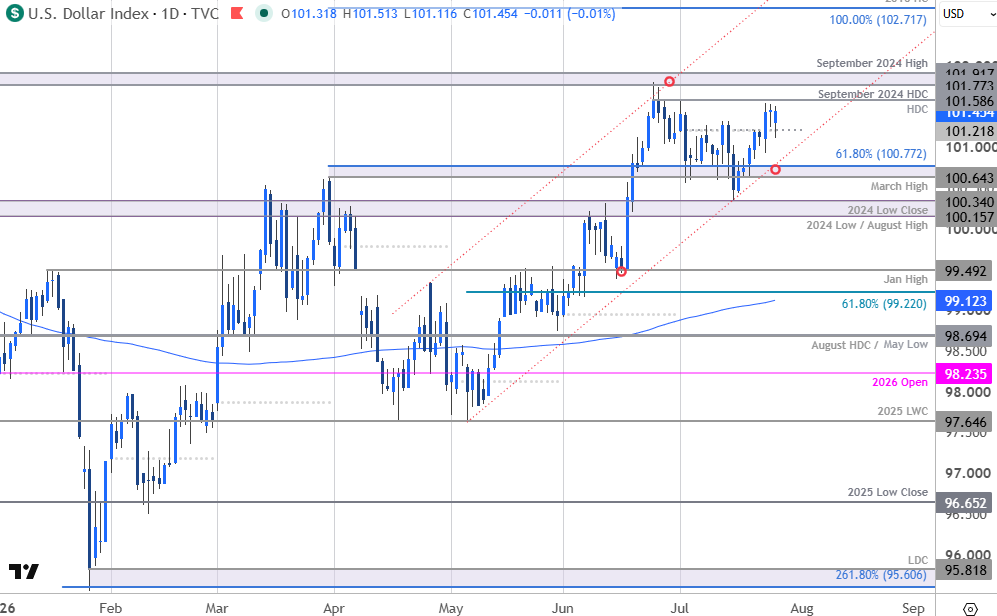
Chart Prepared by Michael Boutros, Sr. Technical Strategist; DXY on TradingView
Notes: The U.S. Dollar Index has been trading within the confines of an ascending channel formation extending off the May low with DXY rallying for seven-of-the-past eight days. The recent recovery is now approaching resistance at the 2026 high-day close and the July opening range high at 101.59. Key resistance is eyed just higher at the September 2024 high-day close (HDC) / high at 101.77/92. A breach / daily close above this threshold is needed to mark resumption of the May uptrend toward the next major technical consideration at the 100% extension of the January advance at 102.72.
Monthly open support rests at 101.22 backed by near-term bullish invalidation at the March high and the 61.8% extension at 100.64/77. Note that channel support converges on this threshold over the next few days. Ultimately, a break / close below the 2024 low / August high at 100.16 would be needed to for the bears to reassert control.
Bottom line: The dollar recovery is now approaching resistance at the yearly high-close with the monthly opening range preserved heading into Fed and the close of July. From a trading standpoint, losses would need to be limited to 100.64 IF price is heading higher on this stretch with a close above 101.92 needed to fuel the next major leg of the advance.
The Fed rate decision is on tap Wednesday and the PCE inflation / GDP data on Thursday. Although the central bank is widely expected to leave rates unchanged, the focus will be on Warsh’s commentary as traders try to gauge where the committee sees inflation amid the recent surge in energy prices. Stay nimble into the releases and watch the weekly / monthly close for guidance here.
Euro Price Chart – EUR/USD 240min
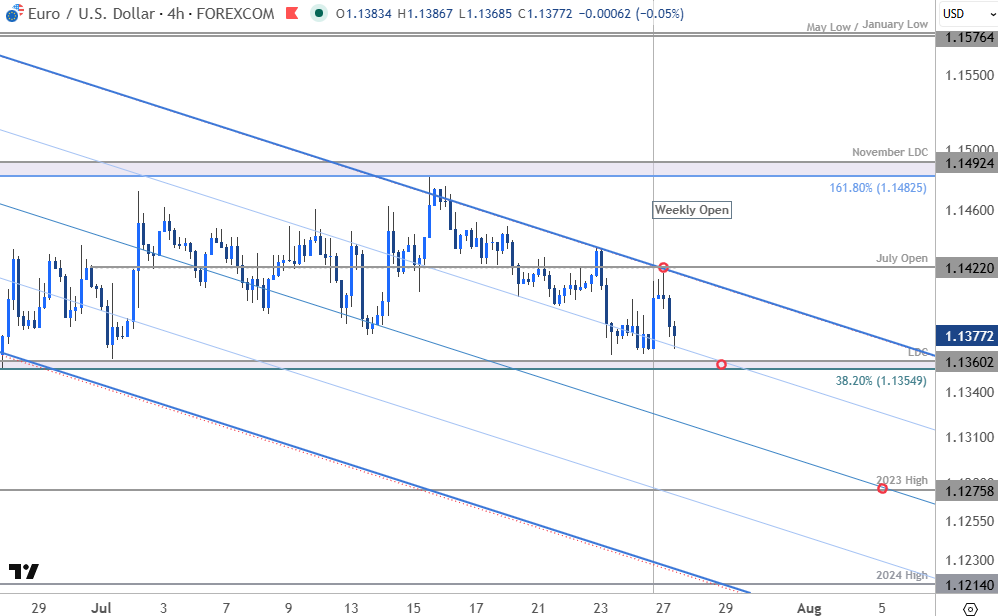
Chart Prepared by Michael Boutros, Sr. Technical Strategist; EUR/USD on TradingView
Notes: Euro is trading just above pivotal support into the start of the week at 1.1355/60- a region defined by the 38.2% retracement of the 2025 advance and the 2026 low-day close (LDC). Note the July opening-range remains intact just above this threshold and we are looking for a breakout to offer further conviction in the days ahead.
Monthly open resistance converges on the upper parallel today at 1.1422 – a breach / close above this threshold would invalidate the April downtrend with a close above key resistance at the monthly range high near 1.1483/92 ultimately needed to reassert the long-bias.
A break / daily close below this key threshold would threaten resumption / acceleration of the broader downtrend with subsequent support objective seen at the 2023 high at 1.1276 and the 2024 high at 1.1214.
Bottom line: Euro is trading just above key technical support at the monthly range low- risk for price inflection into this zone. From a trading standpoint, rallies would need to be limited to the monthly open IF price is heading lower on this stretch with a close below 1.1355 needed o fuel the next major leg of the decline. Keep in mind we get the release of Eurozone inflation data on into the close of the week.
Australian Dollar Price Chart – AUD/USD 240min
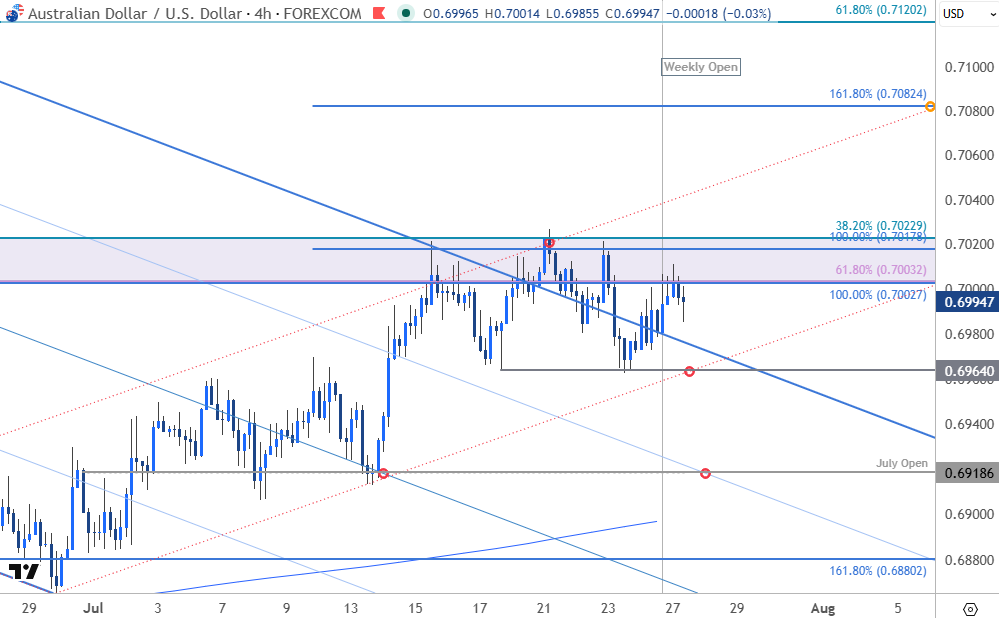
Chart Prepared by Michael Boutros, Sr. Technical Strategist; AUD/USD on TradingView
Notes: AUD/USD is trading just below critical resistance for a third consecutive week at 7003/23- a region defined by the 100% extension & the 38.2% retracement of the May decline, the 61.8% retracement of the March rally, and the 100% extension of the late-June rally. Note that the May downtrend and near-term uptrend resistance converge on this zone and a breach / daily close above would be needed to suggest a more significant low was registered last month and threaten resumption of the broader uptrend.
Initial support rest at last week’s swing low, which converges on near-term channel support at 6964. A break / daily close below this threshold would invalidate the monthly uptrend with a break below the objective monthly open at 6919 needed to mark resumption of the May downtrend. Key support remains unchanged at the 1.618% extension of the May decline and the 200-day moving average at 6880/99.
A topside breach / close above this key pivot zone would validate a breakout of the multi-month downtrend with subsequent resistance objective eyed at the 1.618% extension of the June rally at 7082 and the 61.8% retracement of the decline off the yearly high at 7120.
Bottom line: Aussie is trading just below resistance with last week’s range preserved just below- look for the breakout to offer guidance here. From a trading standpoint, losses would need to be limited to 6964 IF price is heading higher on this stretch with a close above 7023 needed to fuel the next major leg of the advance. Keep in mind we get the release of key Australia inflation data tomorrow night, just ahead of the Fed.
Economic Calendar – Key Data Releases
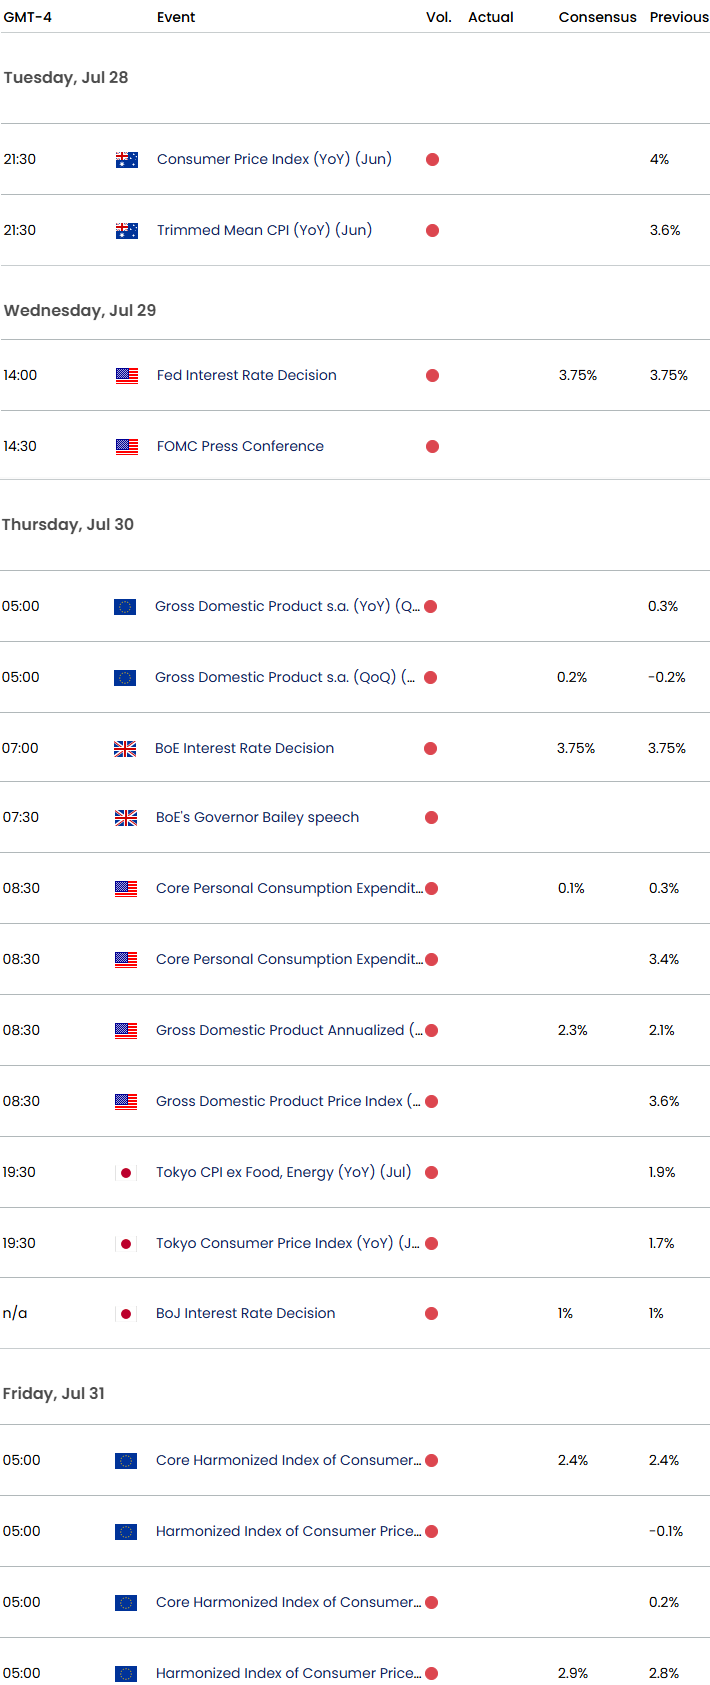
Economic Calendar - latest economic developments and upcoming event risk.
--- Written by Michael Boutros, Senior Technical Strategist
Follow Michael on X @MBForex







Web Trader platform
Our sophisticated web-based platform is packed with features.
Open an account today
Experience award-winning platforms with fast and secure execution.
Economic calendar
Related articles

Euro Short-term Outlook: EUR/USD Pullback Nears Pivotal Uptrend Support 8 28 2026
Warsh's comments accelerated the EUR/USD selloff, raising the stakes as buyers look to stabilize the broader recovery.

Nasdaq 100 Forecast: NDX slips ahead of Fed Chair Warsh’s speech
U.S. stocks are edging lower on Friday, giving back some of yesterday's gains after Nvidia's strong outlook revived the tech trade. The focus has now shifted firmly to Fed Chair Kevin Warsh's Jackson Hole speech, with investors looking for more clarity on the outlook for interest rates.


EUR/USD forecast: All eyes on Warsh at Jackson Hole - Forex Friday
For much of this week, the EUR/USD has been edging lower with the US dollar regaining some ground after last week’s sell-off that was triggered, in part, by the bond market worries. Investors have been unwilling to bet further against the US dollar so far this week ahead of Kevin Warsh’s keynote speech at the Jackson Hole summit, due later today.
