


DXY, Gold Price Forecast: Will Kevin Warsh's First FOMC Halt or Support Gold's Rebound?
DXY, Gold Price Forecast: Gold tests key resistance ahead of Kevin Warsh's first FOMC meeting. Will DXY strength and hawkish Fed risks challenge gold's rebound?
Written by
Razan Hilal
Market Analyst
Risks to gold's rebound remain evident ahead of Kevin Warsh's first FOMC meeting, as headline inflation remains elevated at 4.2% and the US Dollar Index (DXY) continues to hold above the key 99 level, reinforcing the bullish case for the US dollar.
Bloomberg published the memorandum outlining the proposed US-Iran peace agreement, highlighting several unresolved issues that remain under scrutiny. These include:
- a permanent end to Israel-Lebanon hostilities
- Iran's acceptance of nuclear disarmament provisions.
Both clauses could complicate the agreement or extend negotiations within the proposed 60-day framework, while maritime traffic through the Strait of Hormuz is expected to normalize over a 30-day period.
Hormuz Remains the Key Market Driver
The Strait of Hormuz remains the key driver for markets. Optimism surrounding its reopening has pushed crude oil prices back toward the $74 mark, down more than 8% this week, while easing long-term inflation expectations globally.
However, the effects of the recent energy shock and geopolitical risk premium may take time to unwind. As a result, markets remain cautiously constructive, while central banks may maintain a hawkish bias for longer.
This raises an important question ahead of the FOMC meeting: Will Kevin Warsh Kill the Rate-Cut Trade for Good?
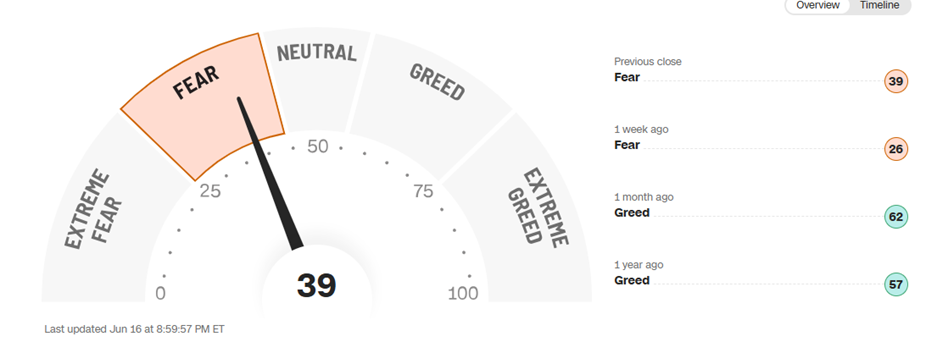
Market Sentiment Remains Cautious
CNN Fear and Greed Indicator
Source: CNN
Despite the rebound in equities and the decline in oil prices, market sentiment remains cautious due to:
- Uncertainty surrounding the US-Iran peace agreement and developments expected later this week.
- Risks of a hawkish tone from the FOMC following rate hikes from the ECB and the Bank of Japan
- The time required to restore supply routes and normalize market conditions to pre-conflict levels.
This cautious sentiment is reflected in the Nasdaq, which has pulled back more than 500 points after an unsuccessful attempt to break above its record highs.
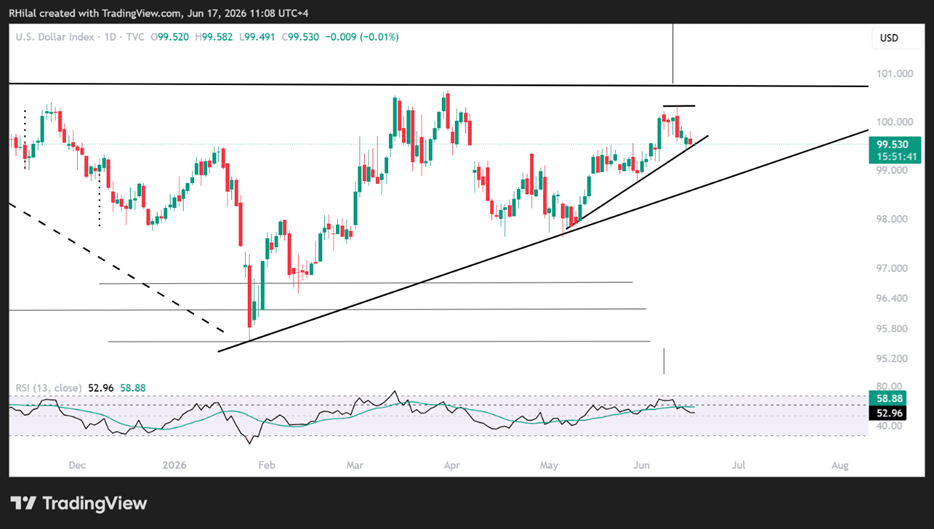
DXY Price Forecast: Daily Time Frame – Log Scale
Source: Trading view
DXY Continues to Respect Key Trend Support
The daily DXY chart continues to reflect the same bullish bias observed on the monthly timeframe:
- Price action continues to respect an ascending support trendline in place since May 2026.
- The broader uptrend from January 2026 remains intact.
- Both trends align with the major rising support structure that has guided the index since 2008, visible on the monthly chart
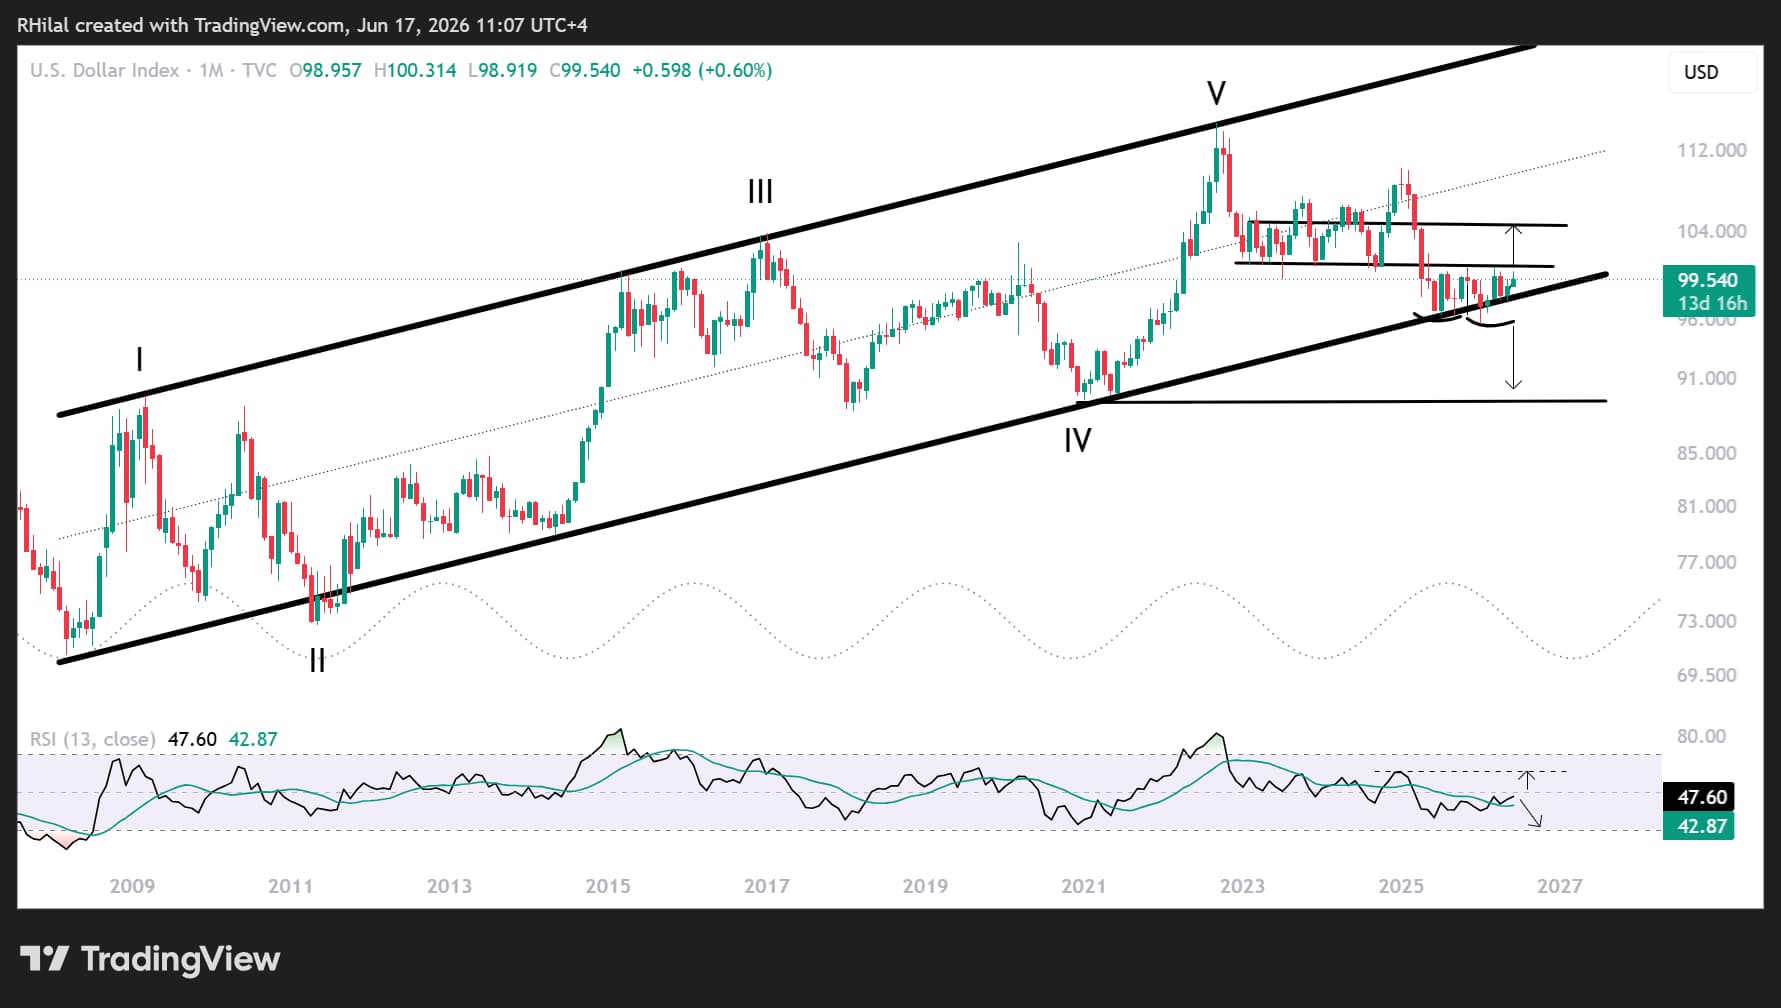
DXY Price Forecast: Monthly Time Frame – Log Scale
Source: Trading view
Why the 100.60–100.80 Zone Matters
The primary bias on the DXY remains bullish unless price action breaks below the key support levels at 98, 97, and 95.
However, if DXY maintains its bullish structure and reclaims the multi-year pivot zone between 100.60 and 100.80, a stronger upside breakout could emerge, potentially increasing pressure on major currencies and precious metals.
A sustained move above this zone would reinforce the case for a stronger dollar heading into the second half of the year, particularly if the FOMC maintains a more hawkish than expected tone.
I discuss these levels in my daily MENA market call, register here for the next webinar: https://attendee.gotowebinar.com/register/1712903232130037596
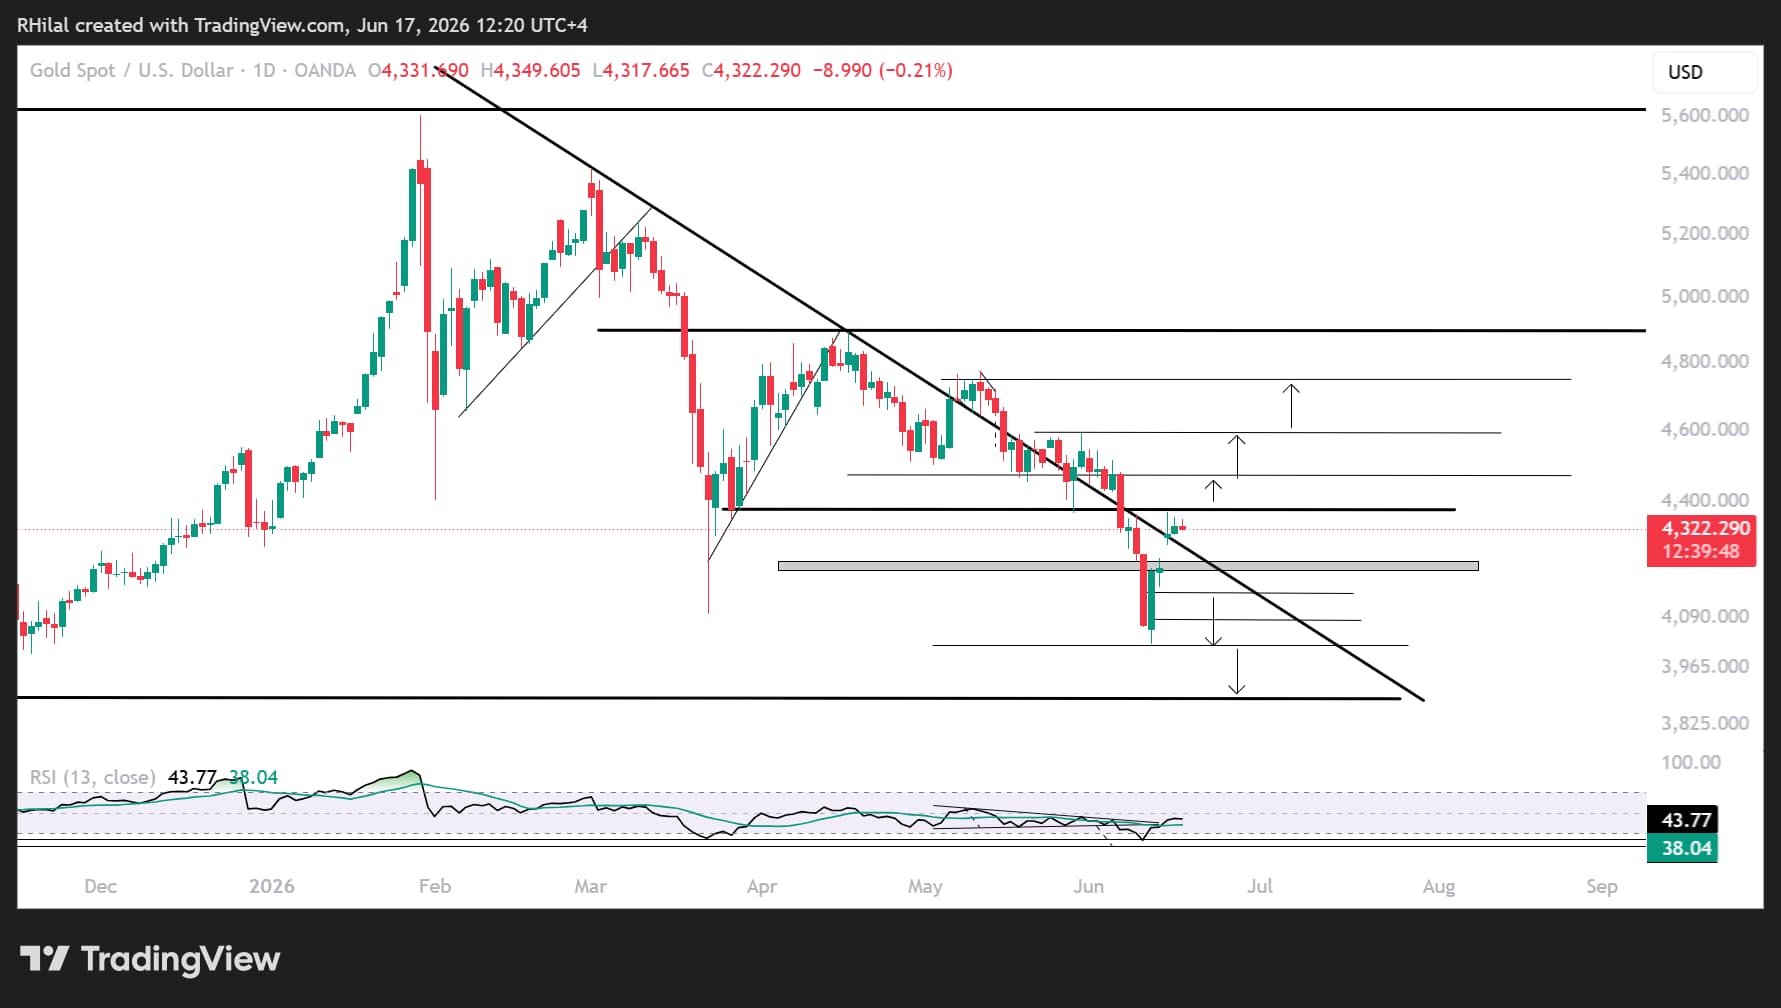
Gold Price Forecast: Daily Time Frame – Log Scale
Source: Trading view
Gold Attempts to Reclaim 4370 Resistance
From a daily perspective, XAU/USD is attempting to reclaim the 4370 resistance level as a platform for another bullish advance.
A successful breakout would also clear the descending trendline connecting lower highs since March 2026, confirming a potential bullish shift in market structure.
For now, the rebound from the 4020 low remains on cautious footing.
Bullish Scenario: Daily Close Above 4370 – 61.8% of the May 29 - June low trend
A sustained daily or weekly close above 4370, accompanied by daily momentum readings moving back above the neutral 50 level, would confirm a medium-term bullish continuation.
Key upside targets derived from the Fibonacci retracement of the May 29 - June low trend stand at:
- 4470 - 78.6%
- 4590 - 100%
A breakout above the June highs and a sustained move beyond 4590 would begin to confirm the longer-term bullish case for gold once again.
Bearish Scenario: Close Below 4280
A close back below 4280 could fill this week's opening gap and expose support levels at:
- 4220
- 4150
A continued breakdown would bring the yearly lows near 4080 and 4020 back into focus before confirming either another bullish rebound or a deeper corrective move toward 3880, October 2025 low.
Gold Price Forecast: 6 Month Time Frame – Log Scale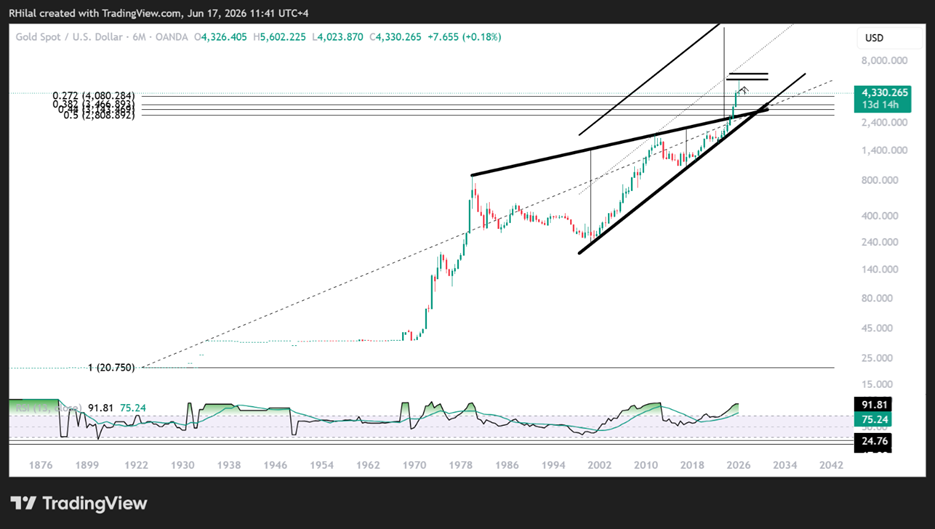
Source: Trading view
A Historic Test for Gold
From a long-term perspective, gold has tested the 0.272 Fibonacci retracement of the 1920–2026 secular uptrend.
This level represents a potentially historic inflection point on the chart, serving either as a major long-term dip-buying opportunity or as confirmation of a deeper corrective phase.
Rebound or Deeper Corrective Cycle?
A sustained rebound from this area would reinforce the broader secular uptrend that has defined gold's performance over the last several years.
Conversely, a confirmed breakdown could expose the next major support zone near 3500, which previously acted as a significant resistance area throughout much of 2025.
The key question remains whether gold can reclaim bullish momentum above 4360 while the US Dollar Index holds near critical resistance levels.
With DXY still respecting long-term trend support and markets reassessing the outlook for rate cuts under Kevin Warsh, the battle between dollar strength and gold resilience remains one of the most important themes to watch during the second half of 2026.
Written by Razan Hilal, CMT
Follow on X: @Rh_waves









Web Trader platform
Our sophisticated web-based platform is packed with features.
Open an account today
Experience award-winning platforms with fast and secure execution.
Economic calendar
Related articles

Canadian Dollar Forecast: USD/CAD Weekly Reversal Puts Yearly Uptrend Back in Focus 8 29 2026
USD/CAD has staged its strongest weekly advance since June, shifting the focus to whether a more durable low is finally taking shape.


USD/JPY weekly outlook: Payrolls may challenge the Fed’s hawkish reset
USD/JPY has finally woken from its slumber. Payrolls now loom as the key test of whether the latest hawkish repricing sticks or sinks.


Euro Short-term Outlook: EUR/USD Pullback Nears Pivotal Uptrend Support 8 28 2026
Warsh's comments accelerated the EUR/USD selloff, raising the stakes as buyers look to stabilize the broader recovery.