


EUR/USD & DXY Forecast: Is Long-Term Positioning Ahead?
EUR/USD and DXY forecast covering Fed policy, Hormuz developments, the petrodollar system, and key technical levels shaping the US dollar outlook.
Written by
Razan Hilal
Market Analyst
The US Dollar Index (DXY) and EUR/USD are testing defining long-term technical levels that could determine whether the next major move is a breakout or a reversal. At the same time, markets continue to weigh persistent US rate hike expectations against the longer-term implications of the evolving payment framework through the Strait of Hormuz.
The key themes I'm watching include:
- The latest speech by Kevin Warsh reiterated a strong commitment to the 2% inflation target, emphasized independence from political pressure, and rejected providing forward guidance, leaving future policy decisions dependent on upcoming FOMC meetings.
- Impact: supported profit taking on dollar pairs in line with softer than expected ADP non farm employment change
- New Hormuz toll settlement mechanisms, allowing payments in the UAE dirham and Chinese yuan rather than the US dollar for sanction-related purposes, continue to test confidence in both the US dollar and the broader petrodollar system at one of the world's most important energy chokepoints.
- Central banks may increasingly favor gold and silver reserves over US dollar reserves, touching a sensitive point in the global monetary system while strengthening the long-term case for precious metals following any near-term correction.
- The US Dollar Index is testing the midpoint of its 2022–2026 declining channel, where the next move could determine whether the broader downtrend accelerates or reverses. At the same time, EUR/USD is approaching the upper boundary of its long-term descending channel that has been developing since 2008, placing both currencies at historically significant technical levels.
- Potential Bank of Japan intervention also remains a risk to monitor as the Japanese yen trades near multi-decade lows.
To follow my live analysis on these charts, along with commodities, join my Daily MENA Market Call.
Register here for the next webinar.
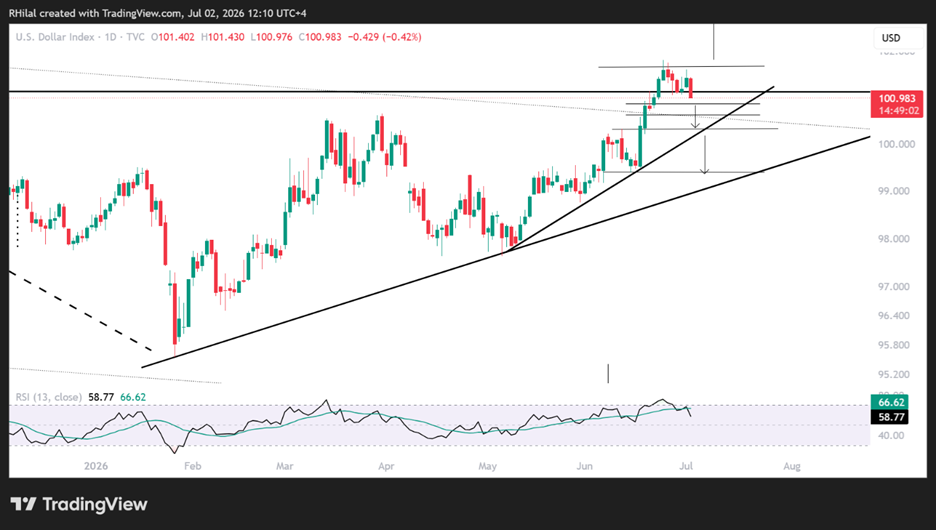
DXY Price Outlook: Daily Time Frame – Log Scale
Source: Trading view
Short-term profit-taking, supported by Kevin Warsh's refusal to provide forward guidance and easing inflation expectations resulting from softer crude oil prices, back to pre war levels, could pressure the DXY into a corrective pullback before the broader trend resumes.
The key downside levels to monitor are:
- 100.80
- 100.60
- 100.30 — a high-probability rebound zone aligning with the 61.8% Fibonacci retracement of the June 15–June 24 rally, while also coinciding with the trendline connecting consecutive higher lows since May 2026
- 99.30
From a broader perspective, however, the monthly chart provides a clearer picture of the dominant trend.
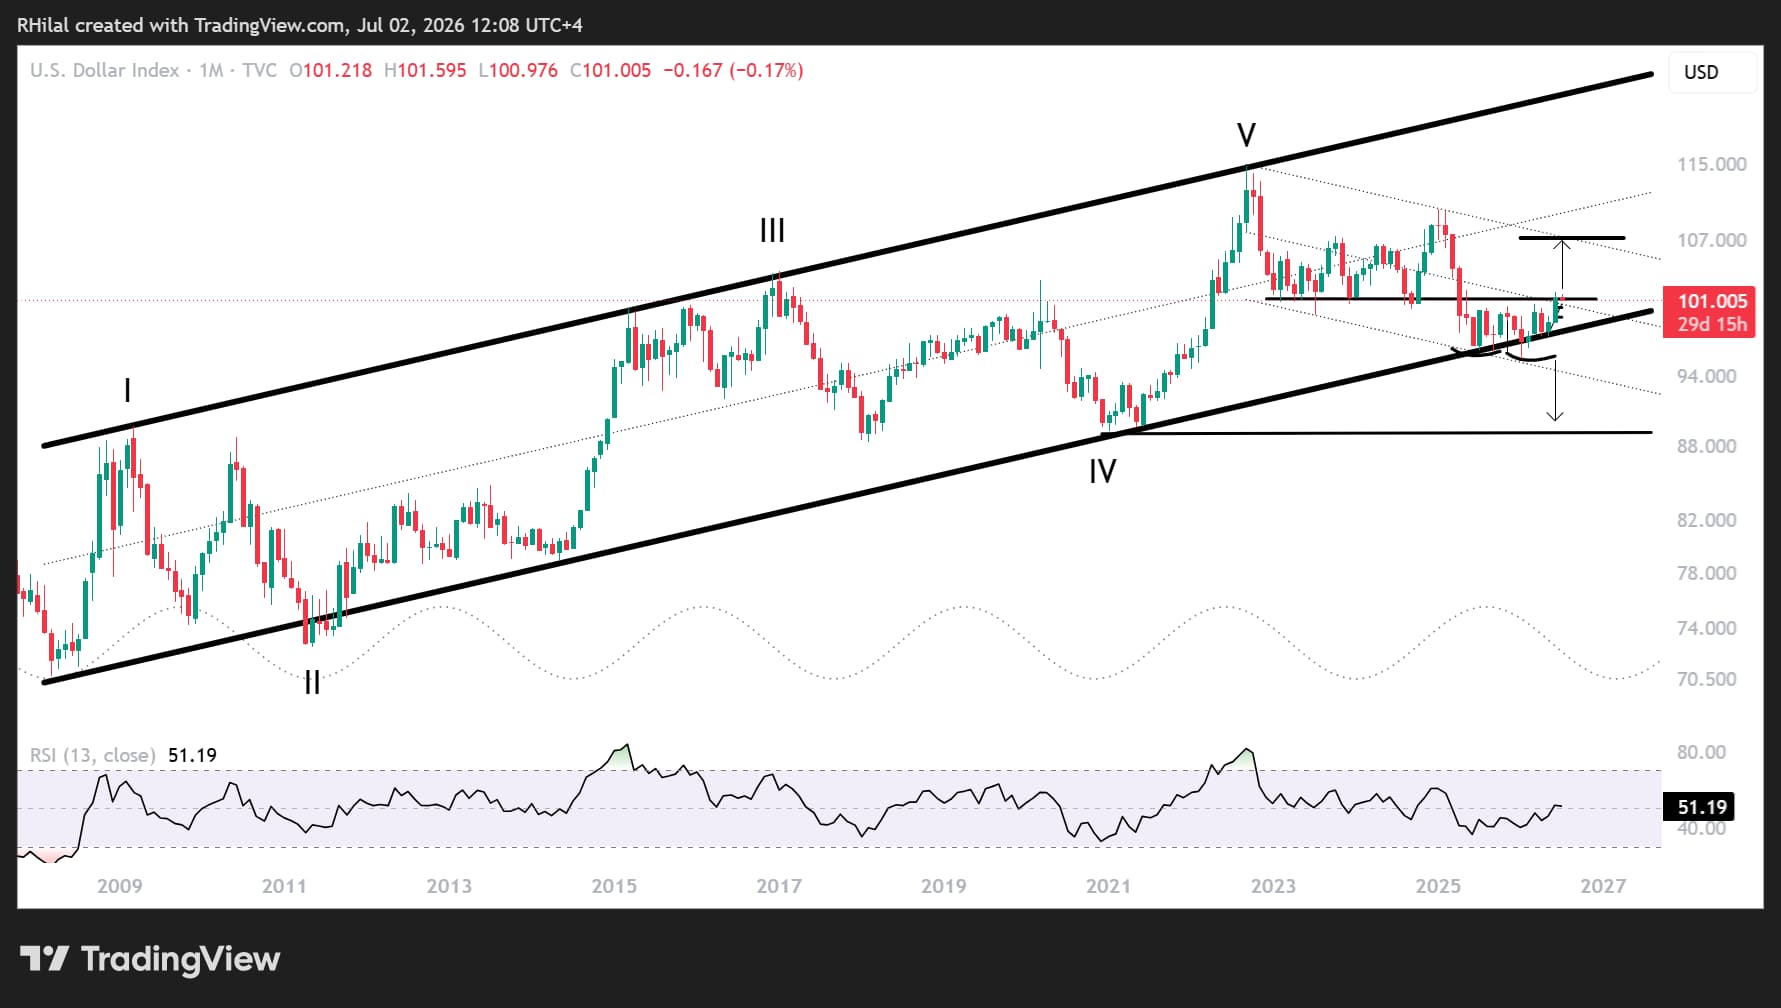
DXY Price Outlook: Monthly Time Frame – Log Scale
Source: Trading view
On the monthly timeframe, the DXY is challenging a major multi-year support-turned-resistance zone that has remained relevant between 2023 and 2026, while simultaneously testing the midpoint of the declining channel extending from the 2022 high through 2026.
A confirmed breakout above 102 would expose the upper boundary of that channel, targeting:
- 102.80
- 104.50
- 107
These levels represent the next major Fibonacci retracement zones of the 2025-2026 decline, before another larger corrective decline in the US dollar becomes more likely.
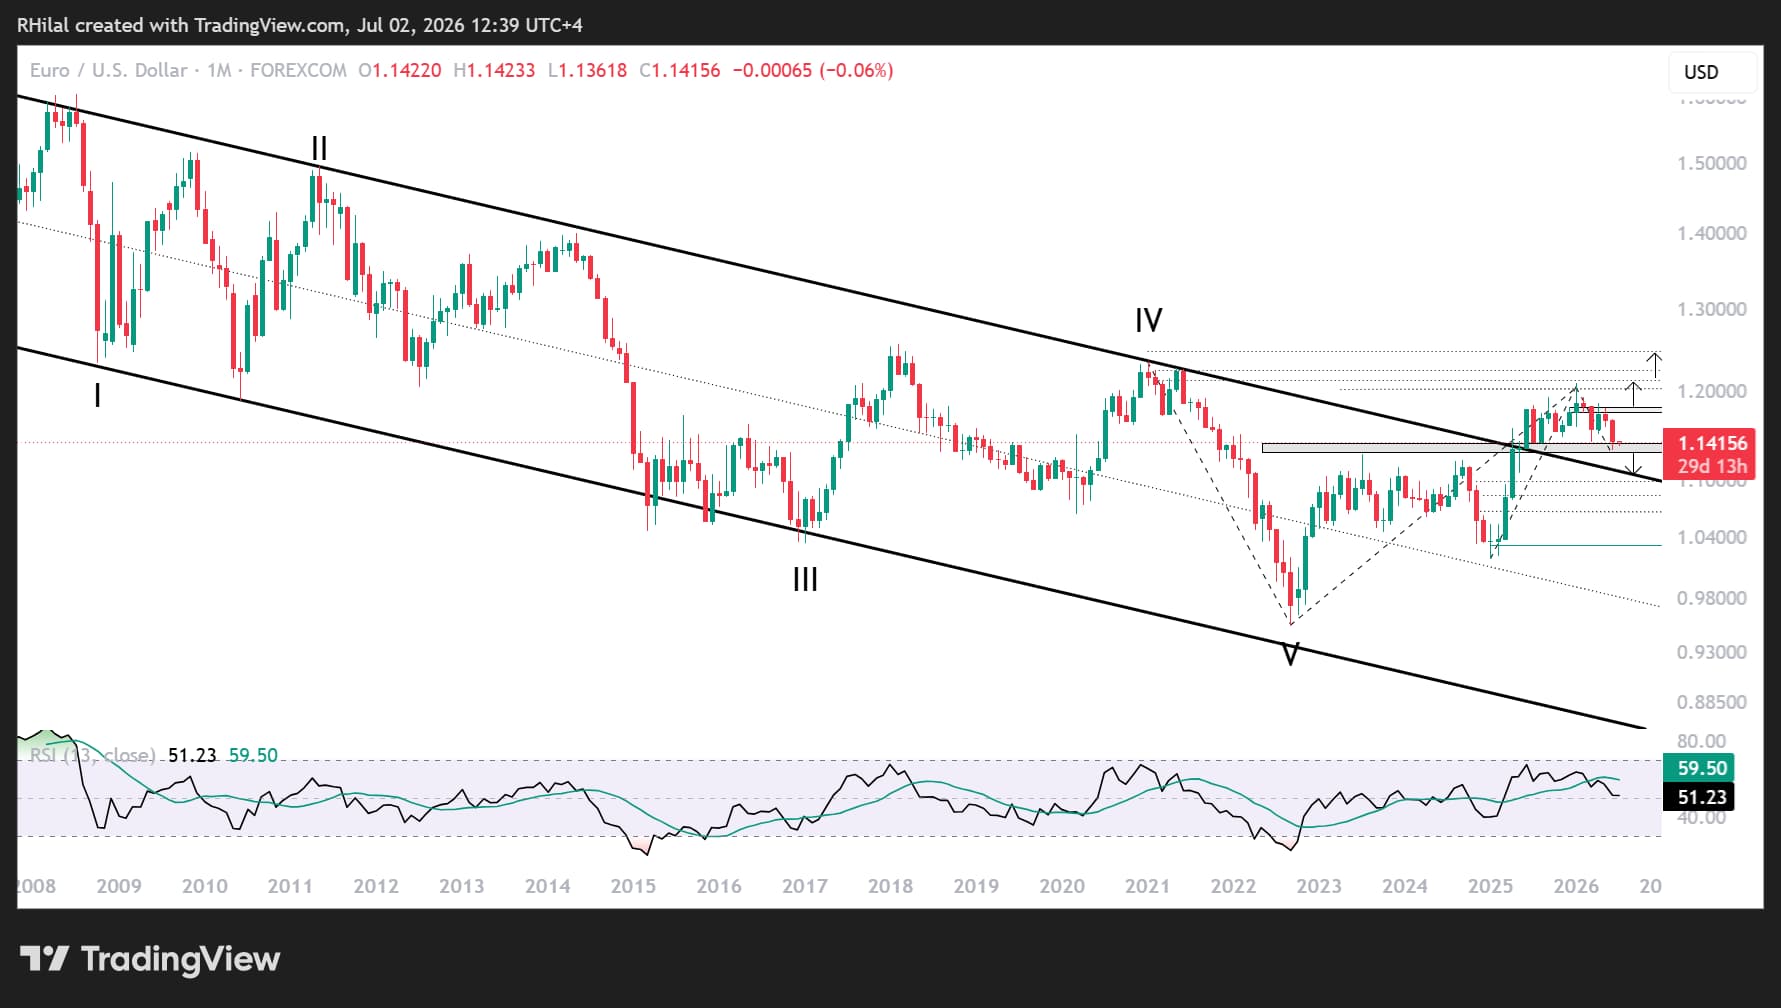
EURUSD Price Outlook: Monthly Time Frame – Log Scale
Source: Trading view
For the euro, 1.13 support zone, combined with the monthly RSI rebounding from the neutral 50 level, increases the probability of at least a short-term recovery toward 1.1430.
The following scenarios the remain in focus.
Bearish continuation
A sustained break below 1.1280, the former resistance-turned-support that has held between 2023 and 2026, would expose the upper boundary of the long-term descending channel near 1.10.
That zone could provide another long-term accumulation opportunity for EUR/USD. Failure to hold above it would increase the probability of a renewed long-term bearish outlook.
Bullish scenario
Holding above 1.1430 would expose the next upside targets at:
- 1.1500
- 1.1630
A sustained breakout beyond those levels would target the 1.1730–1.1800 zone, which remains the defining resistance area separating the long-term bullish and bearish outlook and could eventually open the path toward levels above 1.20.
Written by Razan Hilal, CMT
Follow on X: @Rh_waves
Related tags:







Web Trader platform
Our sophisticated web-based platform is packed with features.
Open an account today
Experience award-winning platforms with fast and secure execution.
Economic calendar
Related articles

Canadian Dollar Forecast: USD/CAD Weekly Reversal Puts Yearly Uptrend Back in Focus 8 29 2026
USD/CAD has staged its strongest weekly advance since June, shifting the focus to whether a more durable low is finally taking shape.


USD/JPY weekly outlook: Payrolls may challenge the Fed’s hawkish reset
USD/JPY has finally woken from its slumber. Payrolls now loom as the key test of whether the latest hawkish repricing sticks or sinks.


Euro Short-term Outlook: EUR/USD Pullback Nears Pivotal Uptrend Support 8 28 2026
Warsh's comments accelerated the EUR/USD selloff, raising the stakes as buyers look to stabilize the broader recovery.