

EUR/USD Breaks Bear Flag After ECB
EUR/USD is breaking down to fresh near-term lows after the European Central Bank rate decision, with the pair now working on a bear flag breakdown.
Written by
James Stanley
Sr. Strategist
EUR/USD Talking Points:
- The European Central Bank rate decision brought Euro weakness today, as Christine Lagarde sounded unconcerned around inflation which decreased odds for near-term rate hikes from the bank.
- EUR/USD was holding in a bear flag formation and is now breaking below the bullish channel, indicating the possibility of bearish continuation of the broader trend.
- As looked at in this week’s USD price action webinar, this is a big component of the USD bullish trend which has also been supported by Yen-weakness and the continued breakout in USD/JPY.
It’s been a rollercoaster of a year for the Euro so far, as the Iran war brought a bid to the currency in April, driven by inflation expectations going higher due to energy prices. The thought there was an energy-vulnerable Europe would be forced into higher prices which would then filter through into other products, and that led to a stronger Euro. But sellers pounced and held the highs around the 1.1850 level, and as US inflation numbers came in higher that dynamic shifted, and then a more-hawkish Fed in response to that inflation helped to bring a bearish trend into the pair in June.
Once below the 1.1500 handle, however, there was a bit of calm starting to show. The pair gyrated higher in a bullish channel, building a bear flag formation, and that led into this week and this morning’s European Central Bank rate decision.
I looked into this in the weekly webinar, and as I shared then, I thought this was a key component for the DXY basket as both the bullish trend in the Dollar and the bearish trend in EUR/USD had been stalled for the past few weeks. Last week brought pullbacks into the mix, helped along by below-target CPI and PPI reports. But the broader trend re-asserted itself as a response to those sell-offs and that has led into today’s setup of continuation.
EUR/USD Daily Chart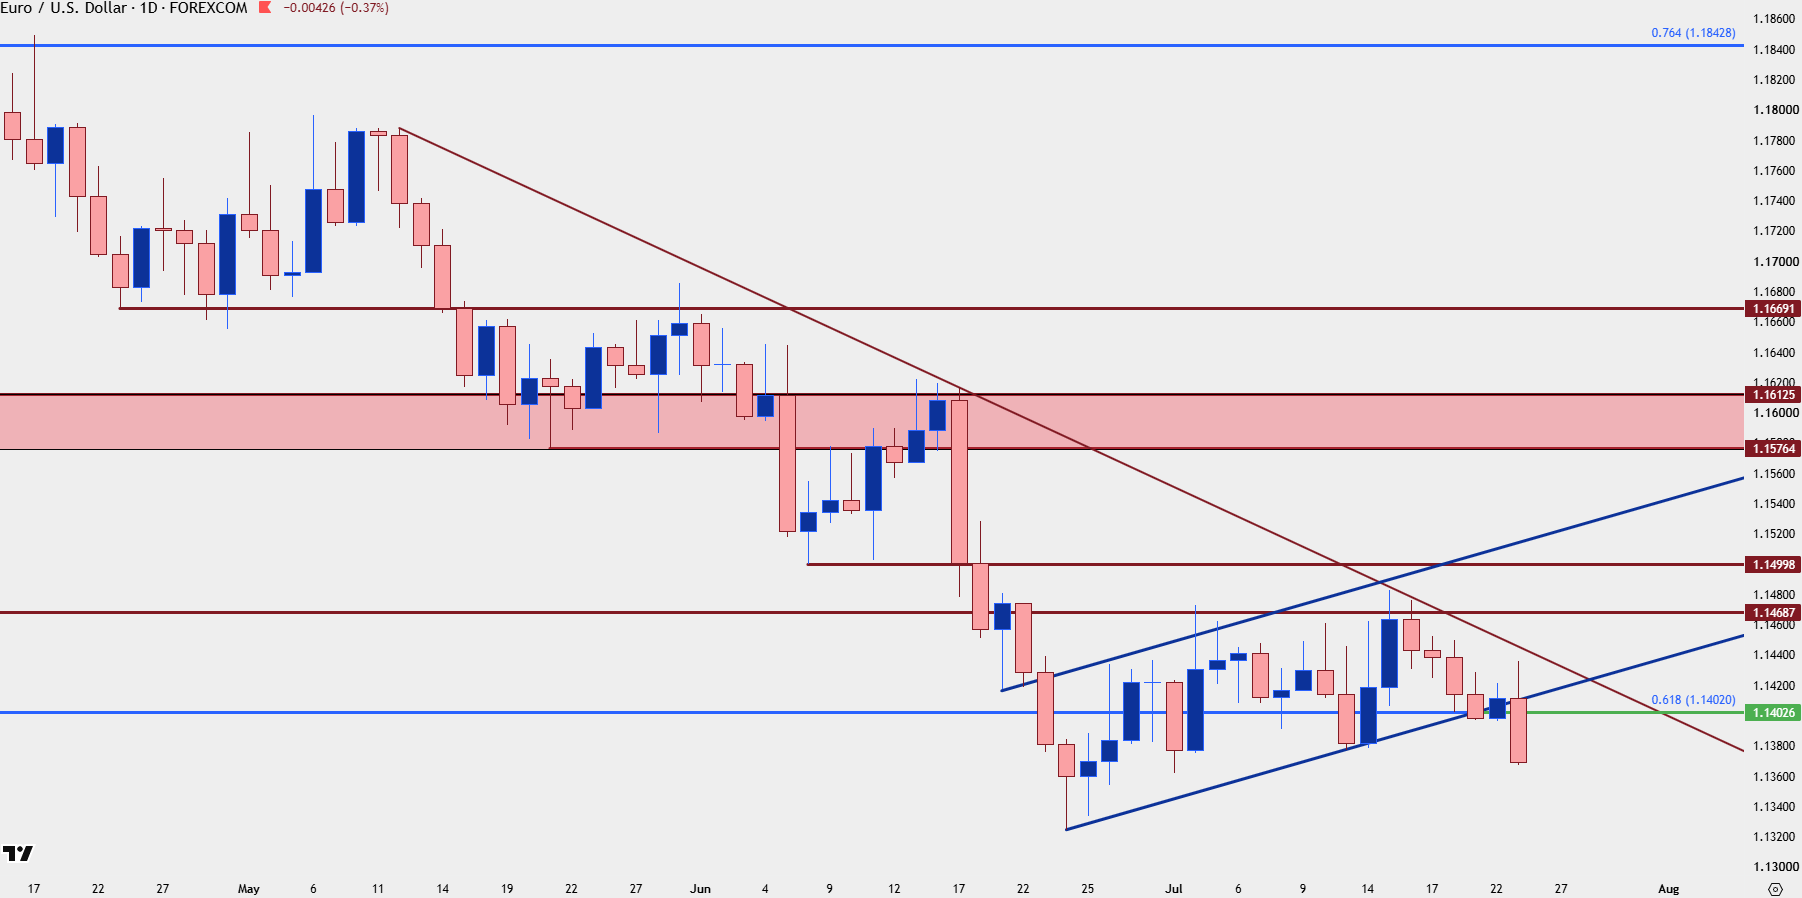
Chart prepared by James Stanley; data derived from Tradingview
EUR/USD Strategy
From the daily bar above we can also see a bearish engulf formation setting up, which hasn’t yet confirmed as we need the daily bar to complete before we can confidently make that claim. If it does, however, that would be a strong indication of bearish continuation potential, as such formations often show after a notable driver pushes price in the direction of the broader trend. In that scenario, the stage sets for a re-test of the prior low at 1.1325, and after that, a major Fibonacci level comes into play at 1.1275 which helped to set the high back in 2023. Below that 1.1200 is the next notable price and at that point, we’d be veering back towards the middle of the longer-term range in the pair.
EUR/USD Weekly Chart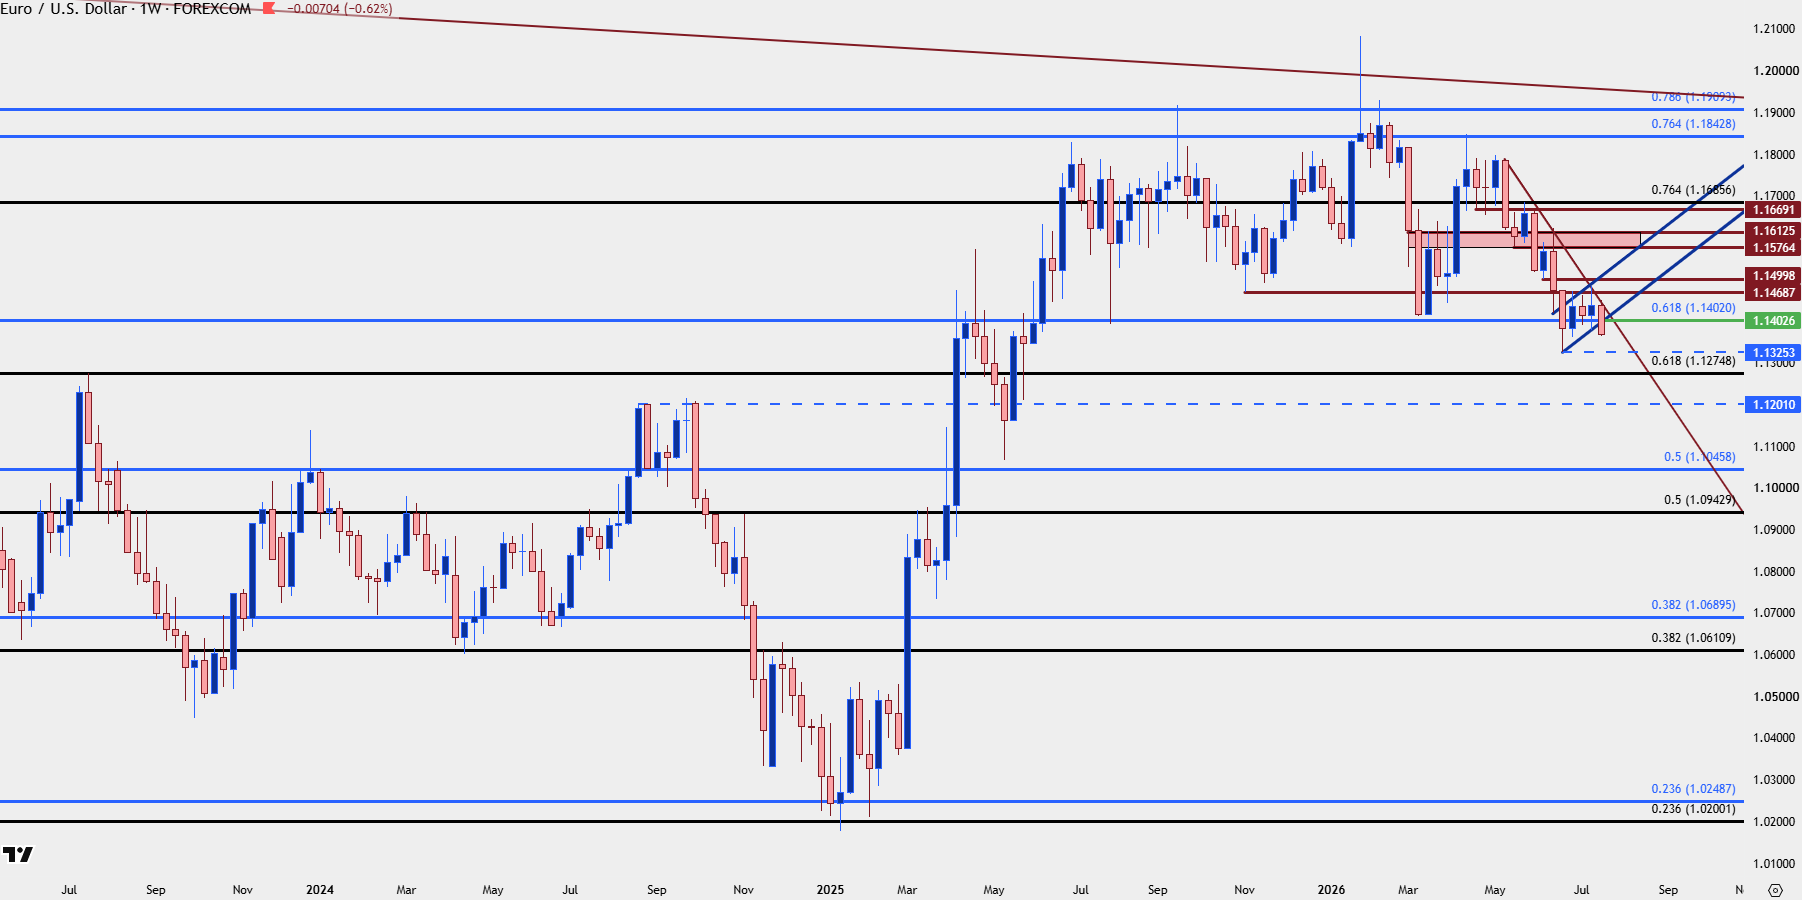
Chart prepared by James Stanley; data derived from Tradingview
EUR/USD Shorter-Term
Given the momentum so far today chasing the move-lower could be a challenge. But, from recent structure, there’s a few key spots to look for lower-high resistance, particularly the 1.1402 Fibonacci level that had previously helped to hold the higher-low before this morning’s breakdown.
The swing high from this morning is also key, as that could serve as a form of invalidation of the short-term bearish momentum, and that plots at 1.1436.
And more aggressively, we have a prior swing low at 1.1378 that could be tracked for those looking for a minor pullback.
EUR/USD Four-Hour Price Chart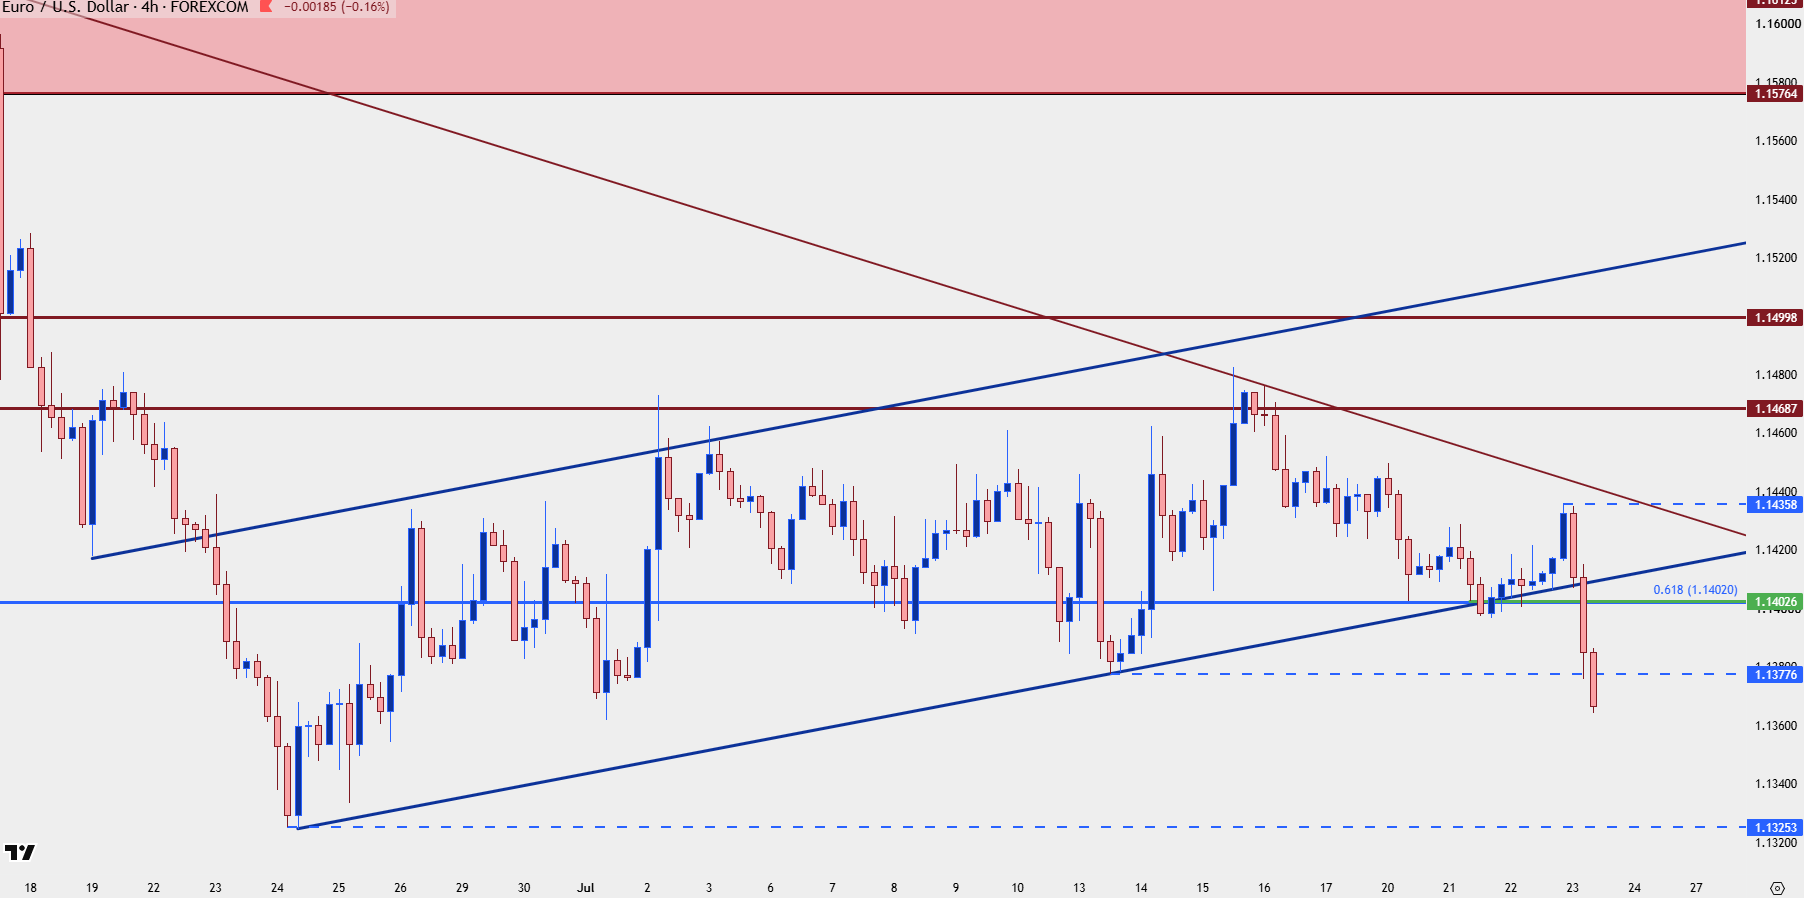
Chart prepared by James Stanley; data derived from Tradingview
--- written by James Stanley, Senior Market Analyst, Global Macro







Web Trader platform
Our sophisticated web-based platform is packed with features.
Open an account today
Experience award-winning platforms with fast and secure execution.
Economic calendar
Related articles

Euro Short-term Outlook: EUR/USD Pullback Nears Pivotal Uptrend Support 8 28 2026
Warsh's comments accelerated the EUR/USD selloff, raising the stakes as buyers look to stabilize the broader recovery.


EUR/USD forecast: All eyes on Warsh at Jackson Hole - Forex Friday
For much of this week, the EUR/USD has been edging lower with the US dollar regaining some ground after last week’s sell-off that was triggered, in part, by the bond market worries. Investors have been unwilling to bet further against the US dollar so far this week ahead of Kevin Warsh’s keynote speech at the Jackson Hole summit, due later today.


AUD/CAD breakout puts the Bradman barrier in sight
A bullish breakout has pushed AUD/CAD to its highest level since early 2021. Whether it can clear 0.9994 may determine if the move extends well above parity.
