

EUR/USD, USD/JPY Outlook: Oil, yields and an FX identity crisis
Crude oil is setting the tone across rates and FX, leaving EUR/USD vulnerable and USD/JPY caught between higher Treasury yields and the growing threat of intervention
Written by
David Scutt
Market Analyst
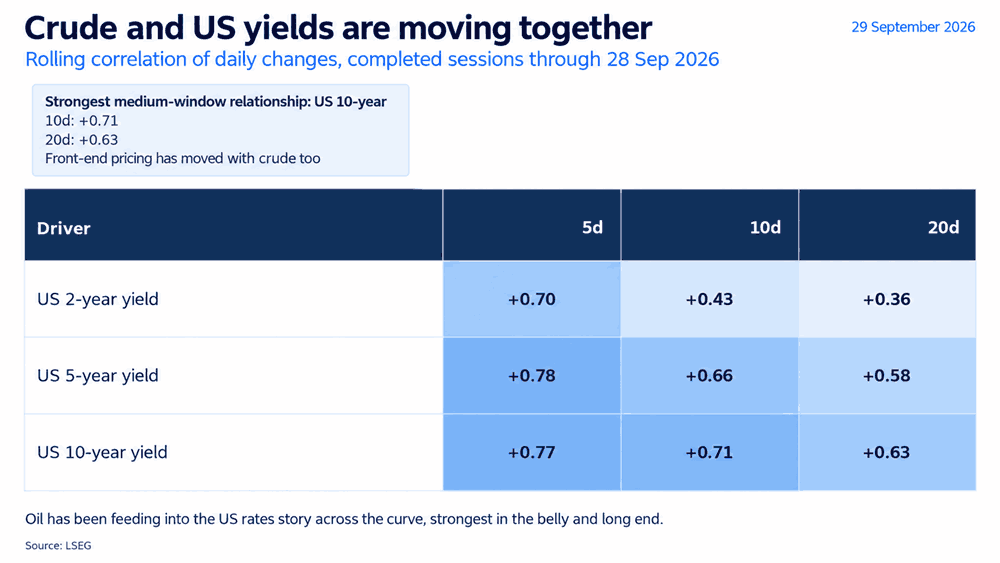
- Brent-US yield correlations remain strongest in belly and long end
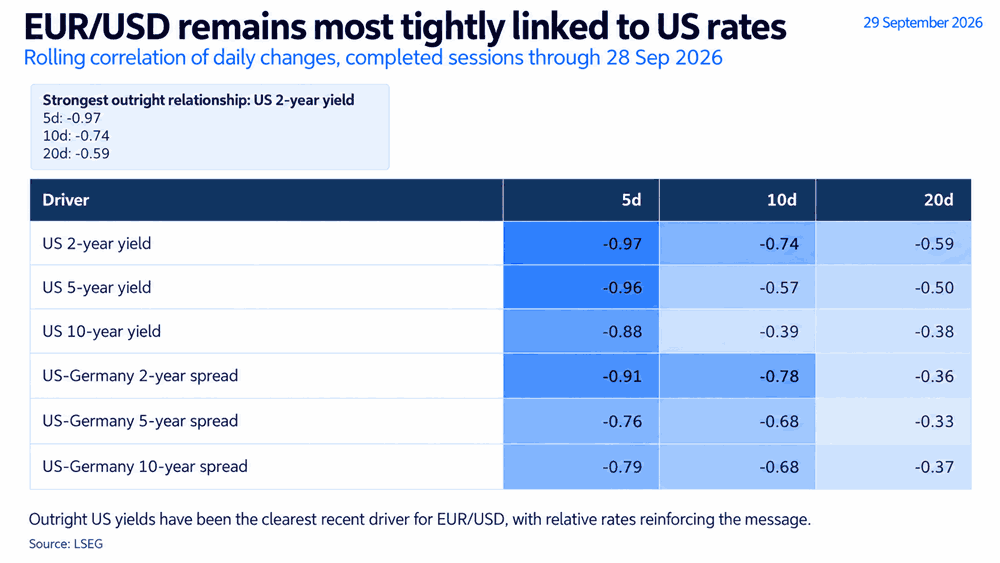
- US two-year yields show the most enduring EUR/USD relationship
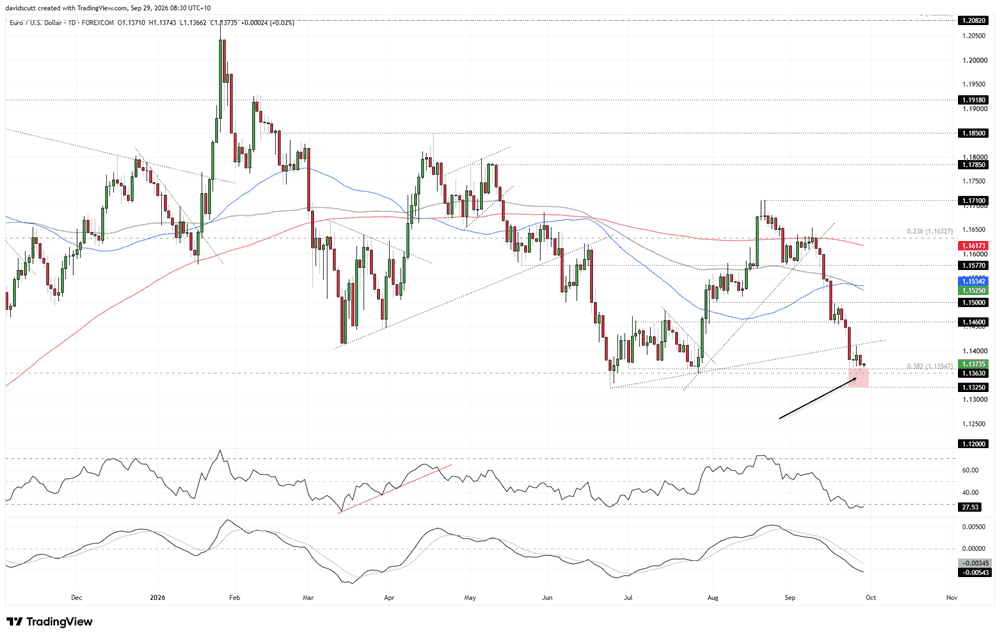
- EUR/USD downside risk rises if 1.1325 support cracks
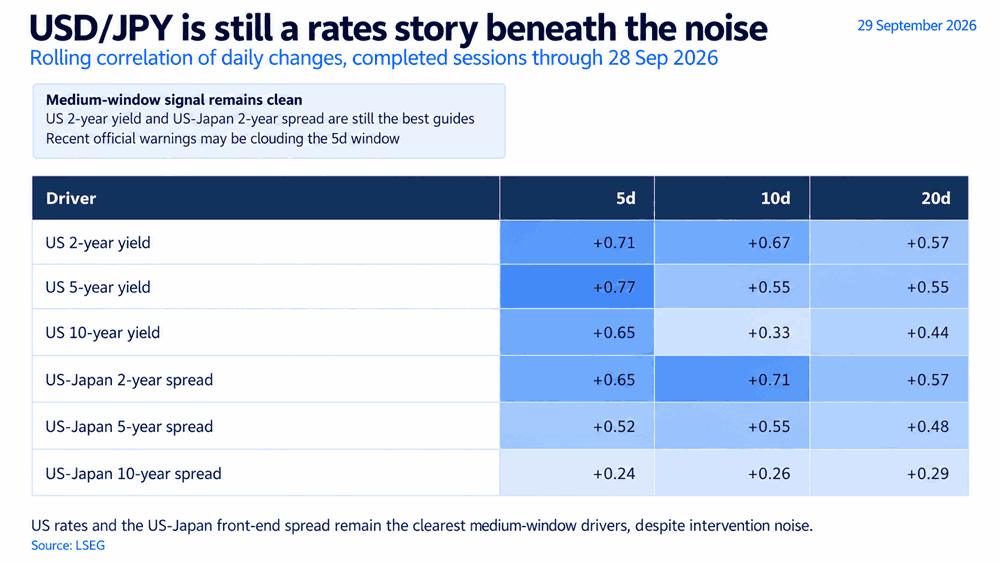
- USD/JPY correlations remain firm across US yields and rate spreads
- 158.00–158.50 remains key USD/JPY intervention danger zone
EUR/USD and USD/JPY traders may be experiencing something of an identity crisis right now, wondering whether they’re actually trading crude oil futures rather than FX markets, with an incredibly tight link evident between gyrations in energy markets, US yields and broader FX movements.
With little on the economic calendar in Europe, the United States or Japan today to distract markets from this energy market obsession, crude looks set to continue exerting a strong influence on both pairs as we head towards payrolls on Friday.
Oil remains at the centre of the macro trade
It’s not just US Treasuries fluctuating in line with crude futures, but the broader developed-market sovereign debt complex. But it’s movements in Treasuries that are proven to be very influential on broader movements in currency pairs.
Source: LSEG
Across five, 10 and 20-session windows, there has been a strengthening relationship between Brent crude and the US yield curve, with the strongest and most consistent link seen in the belly and long end rather than front-end rates. Although the two-year has demonstrated a relatively tight link, particularly over the past week.
US rates keep EUR/USD under pressure
The next graphic shows that for Europe’s common currency, there has been an almost lockstep inverse relationship between shifts in US yields and movements in EUR/USD, with the most enduring relationship at the front end of the curve.
Source: LSEG
Similarly strong inverse relationships are also seen between US and German two, five and 10-year yield spreads. Although, getting back to what was mentioned earlier, that likely reflects sovereign debt markets currently moving to the tune of crude oil futures.
So, from a directional perspective, it’s clear that EUR/USD remains tied to the hip with movements across the US yield curve.
EUR/USD waits for a catalyst
Source: TradingView
However, the daily chart shows technicals still matter, with the pair continuing to bounce off a broader support zone comprising horizontal support at 1.1363, the 38.2% Fibonacci retracement of the January 2025 to January 2026 bull move, and 1.1325, the low set on June 24 this year.
Given the run of lower highs and lower lows, along with the break beneath the key medium and long-term moving averages, the risk of a downside break is elevated.
RSI (14) remains in oversold territory beneath 30, indicating that while downside pressure has stopped building for the time being, it’s not dissipating either. That message is backed up by MACD, which staged a bearish crossover, flipped negative and remains beneath the signal line.
If the recent downtrend extends with a break beneath 1.1325 that sticks, there’s very little technical support until 1.1200, with the 50% retracement of the January 2025 to January 2026 move around 1.1130. 1.1100 is another level of note given it acted as support and resistance for periods in the first half of 2025.
If the bearish move were to show signs of reversing, which at this stage it is not, the uptrend from the late-June low is located today around 1.1420. The price tested it from beneath late last week and was rejected, meaning it should be on the radar for bulls and bears if we get a bounce back towards that level.
Overhead, 1.1460 and 1.1500 have both acted as support and resistance over recent months before we get to the confluence of the 50 and 100-day moving averages just above.
Even with the technical picture still favouring selling strength and downside breaks, the lack of any clear escalation in the Middle East makes me question whether the pair has the fundamental catalyst required to break this support zone cleanly in the immediate term. For now, the conflict looks more like a stalemate, which may leave EUR/USD stuck in this rangy price pattern until something changes.
But putting my geopolitical risk hat on, which is arguably amateur at best, my sense is that the risks surrounding the conflict in the Gulf may now be asymmetrically skewed towards lower energy prices and potentially a relief valve for the euro after the significant move in energy markets we’ve already seen.
That doesn’t change the technical message, which still favours selling strength and downside breaks. But without another clear escalation, I’m not convinced the catalyst is there right now to force a sustained break lower.
Intervention risk clouds the rates signal
Much like for EUR/USD, the linkages between USD/JPY and movements across the US curve and front-end rate spreads remain strong and sustained, albeit not to the level seen for the common currency.
Source: LSEG
That’s because while higher Treasury yields, along with the US standing as a major energy producer, puts it in a comparatively strong position relative to Japan, a major energy importer, it’s not just energy markets that USD/JPY traders are having to grapple with now, but the ongoing and persistent threat of intervention, either from the Japanese authorities or, in some instances, the US Treasury.
That was seen again on Monday with a stark warning from Atsushi Mimura, Japan’s FX czar, who delivered what, for me, came across as one of the most frantic warnings yet for traders to heed the message that both Japanese and US authorities believe the yen is undervalued.
Mimura said markets should take at face value the “very clear” message delivered by US and Japanese authorities last week, adding that he would be watching closely to see whether markets continued to do so.
The yen subsequently strengthened sharply in early European trade, although continued gains in US Treasury yields saw it recover all of those losses and then some into the close.
158 remains the intervention danger zone
Source: TradingView
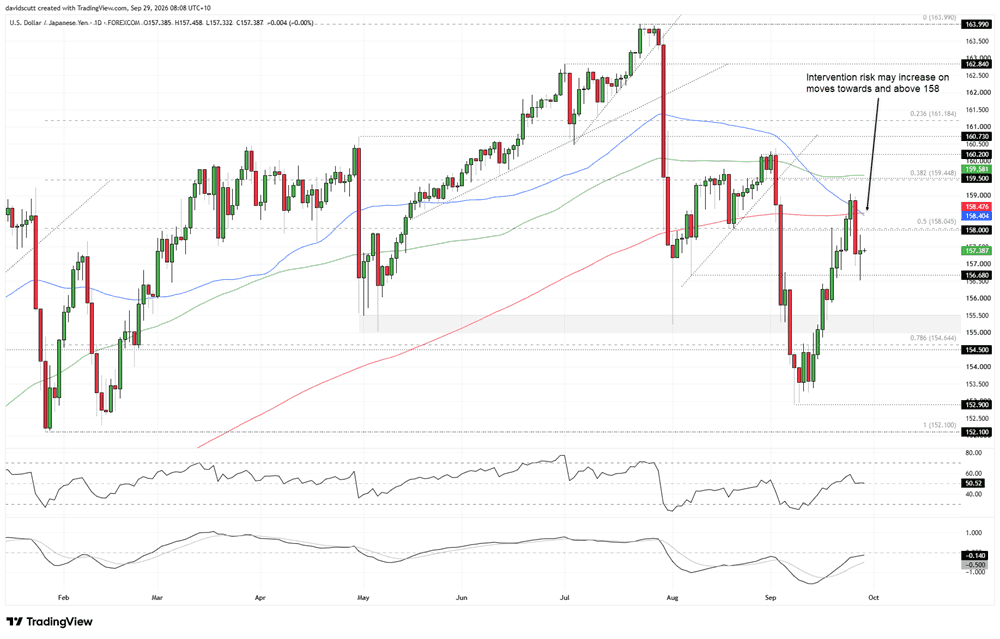
The conflicting forces between higher energy and Treasury yields and Mimura’s warning created whipsaw movement on the USD/JPY daily chart, eventually delivering a long-legged doji, reinforcing the market’s confusion as to exactly how to proceed.
From the intervention side of the equation, the suspected rate check conducted last Friday, which saw the pair reverse sharply after breaking above the key 158.00 resistance zone and reclaiming the 50 and 200-day moving averages, suggests to me that rallies back towards 158 and above may induce actual intervention activity on the next occasion, should it take place.
That means 158.00, and the zone between there and the confluence of the 50 and 200-day moving averages, remains the level to watch overhead, with 159.00 and 159.50 next. The latter coincides with the 38.2% Fibonacci retracement of the 2026 low-high and the 100-day moving average.
Underneath where USD/JPY now trades, 156.68 support held again on Monday, making it the immediate focal point. If broken convincingly, there’s a broader support zone from 155.50 down to 155.00, which repeatedly managed to absorb offers during intervention episodes earlier this year.
The message from the oscillators, for what it’s worth in this environment, is broadly neutral, putting greater emphasis on price action and headlines to drive directional risks.
Latest market news










Web Trader platform
Our sophisticated web-based platform is packed with features.
Open an account today
Experience award-winning platforms with fast and secure execution.
Economic calendar
Related articles

Nasdaq 100 Forecast: NDX slips ahead of Fed Chair Warsh’s speech
U.S. stocks are edging lower on Friday, giving back some of yesterday's gains after Nvidia's strong outlook revived the tech trade. The focus has now shifted firmly to Fed Chair Kevin Warsh's Jackson Hole speech, with investors looking for more clarity on the outlook for interest rates.


EUR/USD forecast: All eyes on Warsh at Jackson Hole - Forex Friday
For much of this week, the EUR/USD has been edging lower with the US dollar regaining some ground after last week’s sell-off that was triggered, in part, by the bond market worries. Investors have been unwilling to bet further against the US dollar so far this week ahead of Kevin Warsh’s keynote speech at the Jackson Hole summit, due later today.


Bitcoin Forecast: BTC/USD Back to $80K Ahead of Warsh’s Jackson Hole Speech
After surging over $15,000 in the past 10 days alone, there is risk of a near-term pullback if Warsh says anything remotely hawkish at Jackson Hole - what are the levels to watch from here?
