


EURUSD Analysis Euro gains momentum after US CPI
As the trading week begins, the euro is once again showing a short-term bullish bias after the release of inflation data in the United States, which has helped ease strength around the U.S. dollar.
Written by
Julian Pineda
Market Analyst
As the trading week begins, the euro is once again showing a short-term bullish bias after the release of inflation data in the United States, which has helped ease strength around the U.S. dollar.
For now, EUR/USD is up more than 0.6% during the session and continues to trade above the 1.1400 level. This buying pressure is partly due to the fact that the new inflation data has triggered corrections in the U.S. bond market, a dynamic that does not favor the dollar.
If this behavior continues, relevant buying pressure could remain present in EUR/USD movements over the next few trading sessions.

U.S. CPI day arrives
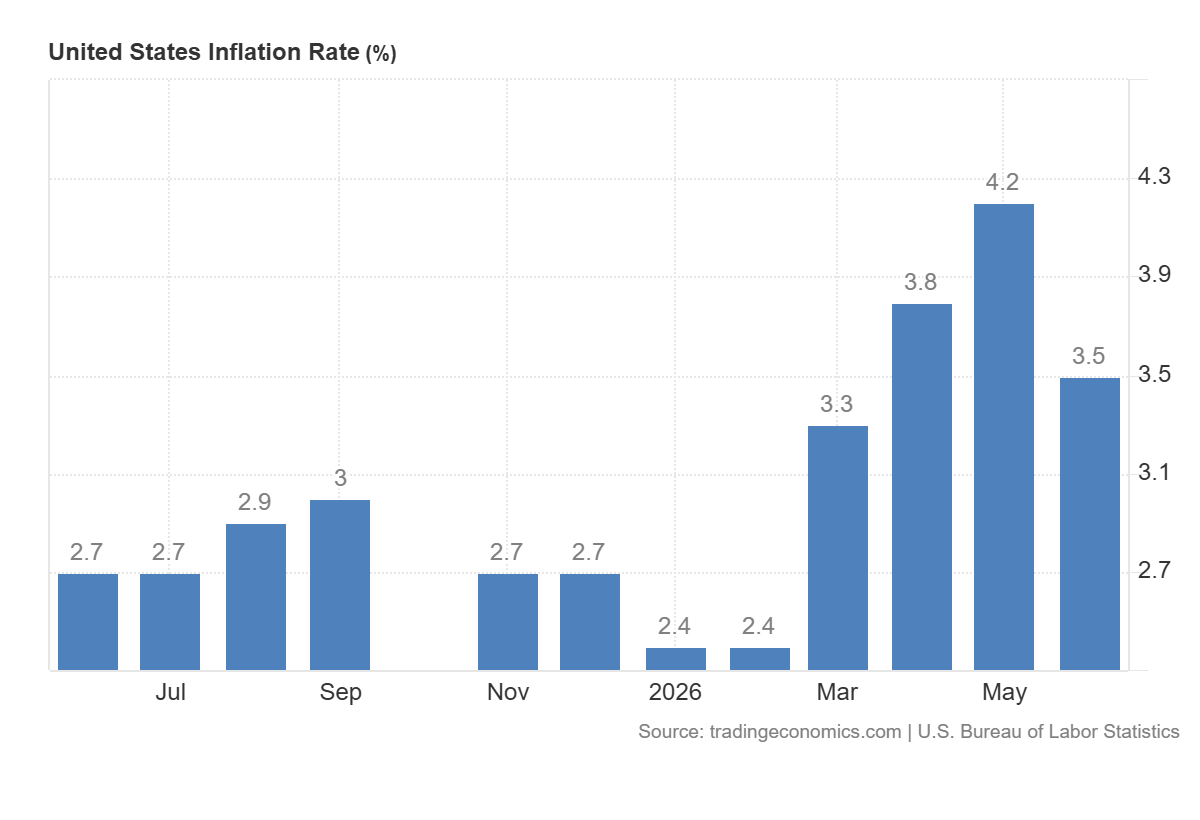
During the session, CPI data in the United States was released. Although an annual reading was expected, the official figure surprised to the downside and came in at 3.5%.
This figure marks an important change in the U.S. price dynamic, as it represents one of the most relevant declines of the year. In addition, June inflation moved away from the annual high of 4.2% and broke the upward trend that had been present in annual inflation levels since March.
With this result, inflation is once again moving somewhat closer to the central bank’s annual 2.00% target.
Source: TradingEconomics
This event is relevant for Federal Reserve expectations, as a consistent slowdown in inflation could prevent the view of a fully aggressive central bank from materializing over the coming months.
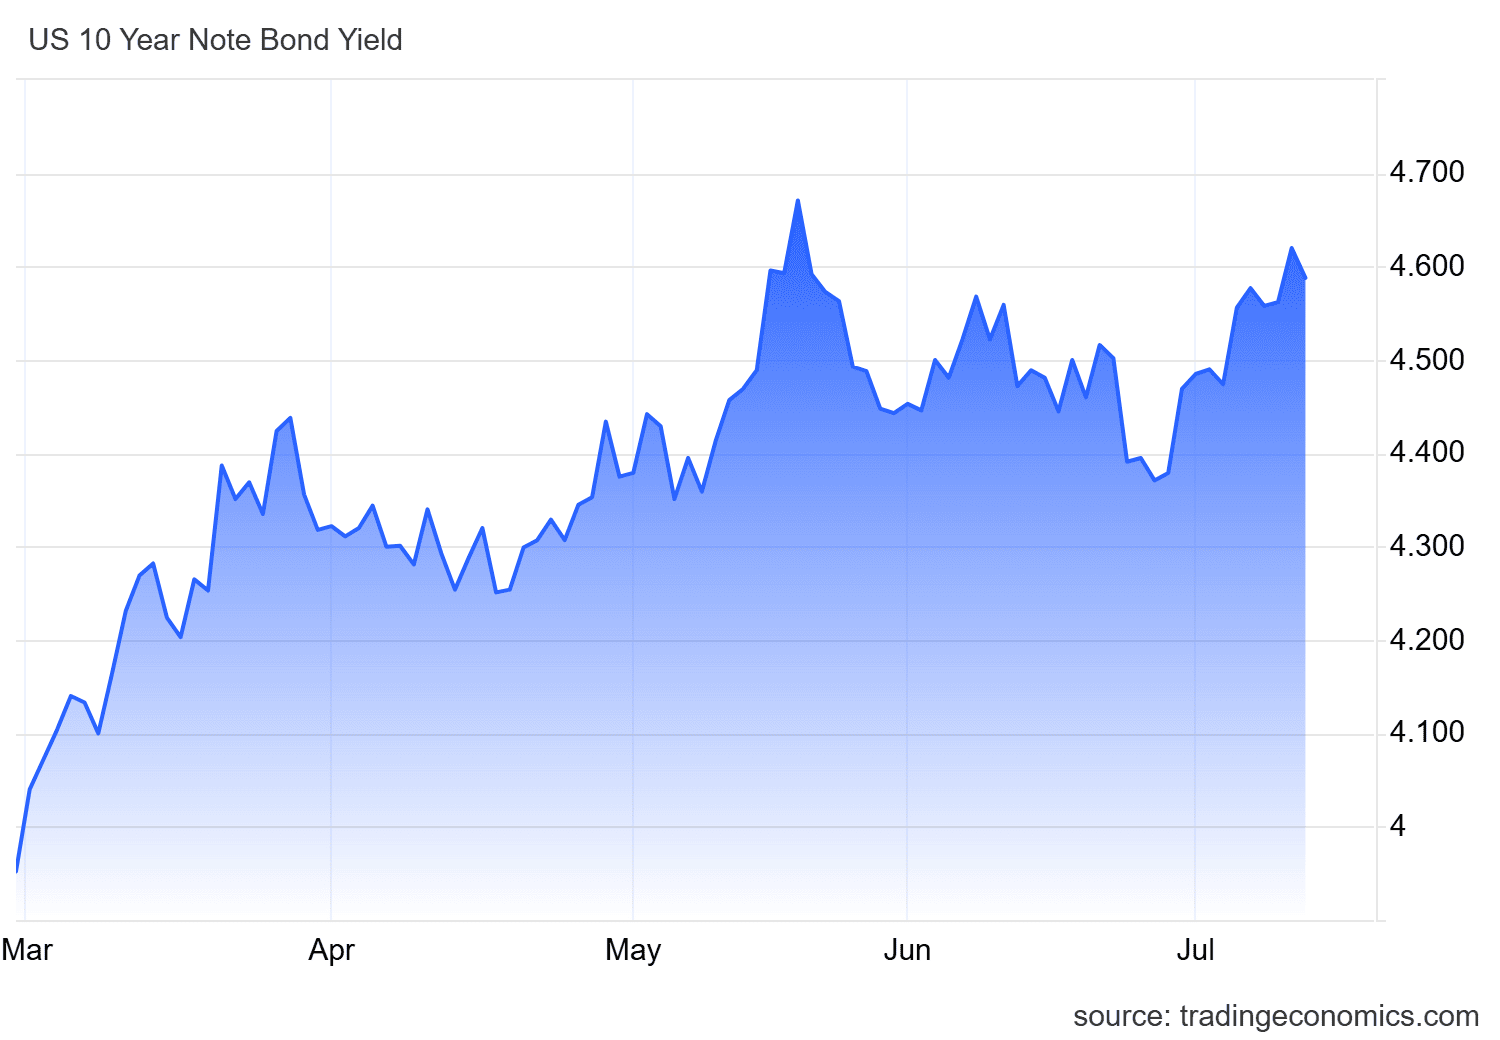
As inflation declines, the need to keep interest rates higher for a prolonged period also decreases. This perspective has started to be reflected in the 10-year U.S. bond market, where yields have shown some correction amid lower expectations of central bank aggressiveness.
After the upward trend seen last week, yields have started to move back below the 4.6% area, showing relevant weakness that had not been observed in recent sessions.
Source: TradingEconomics
The key point is that, as bond yields show weakness, the relative appeal of these fixed-income instruments compared to other markets may also decline. This could reduce the need to maintain consistent demand for dollars in order to access these types of assets.
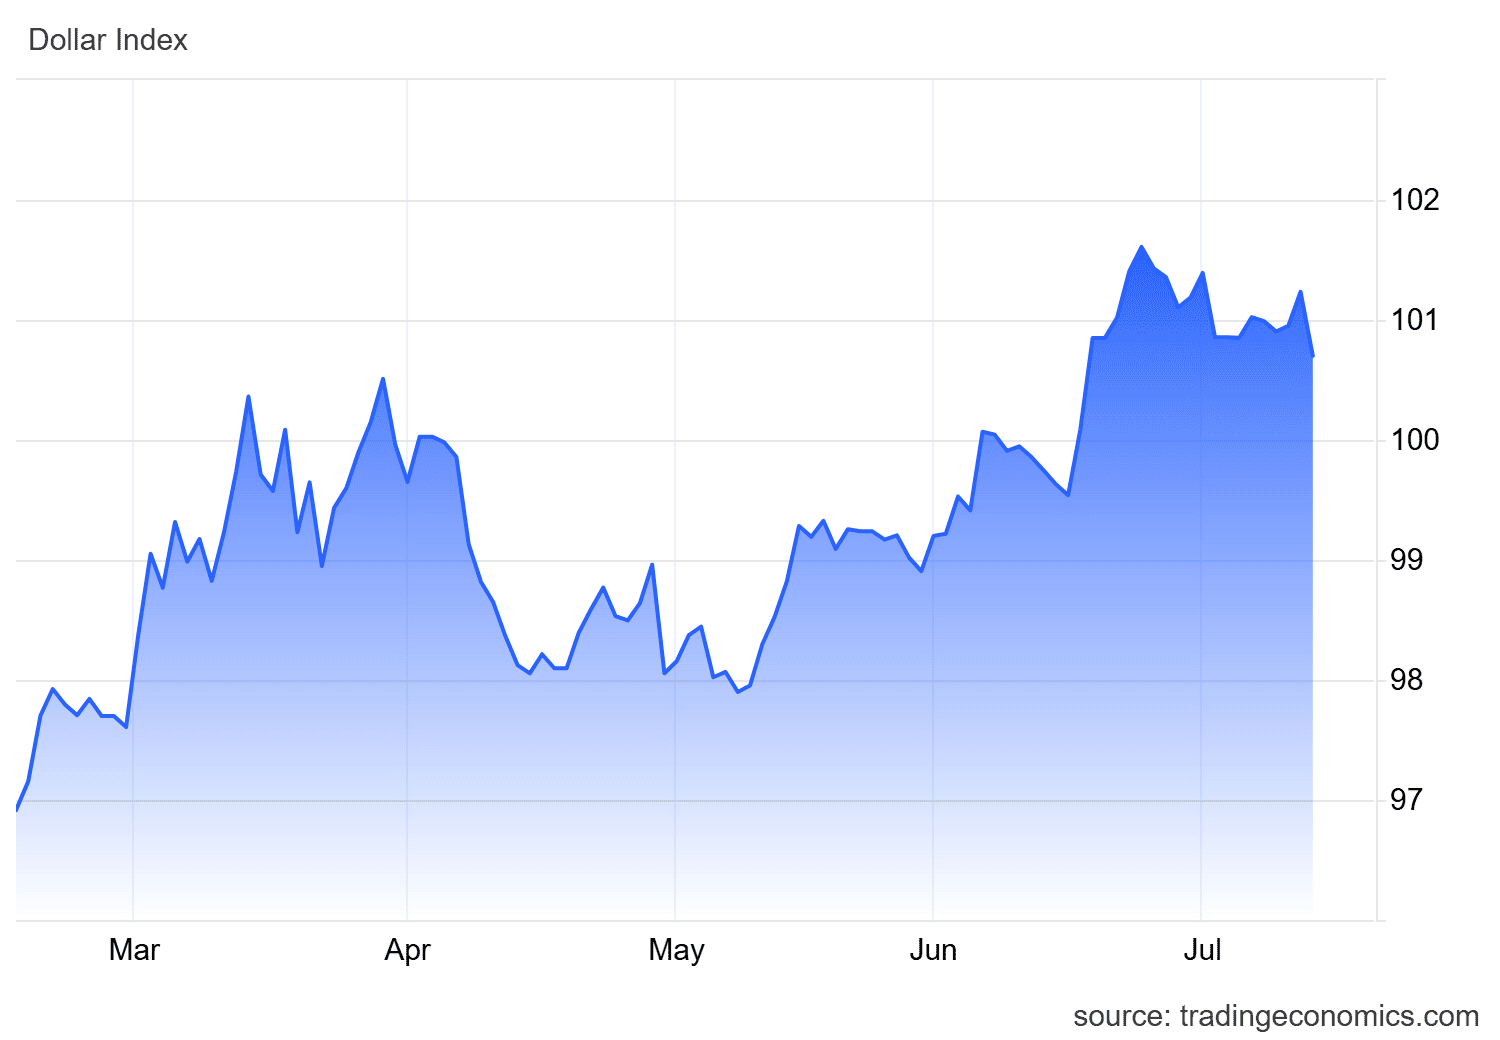
This decline in bond yields coincides with weaker demand for U.S. dollars. This behavior is reflected in the DXY index, which measures the dollar’s strength against its main peers. The index is now showing a relevant decline and is approaching the 100-point reference area. This indicates that demand for dollars has started to weaken in the short term.
Source: TradingEconomics
With all of this in mind, the dynamic has been favorable for the euro. The release of the inflation data created renewed weakness in dollar demand, which could be allowing the euro to recover ground in the short term.
If the U.S. bond market fails to show attractive growth in yields, the dollar could continue to lose ground. In that scenario, EUR/USD could maintain relevant buying pressure over the next few trading sessions.
Technical outlook for EUR/USD
Source: StoneX, Tradingview
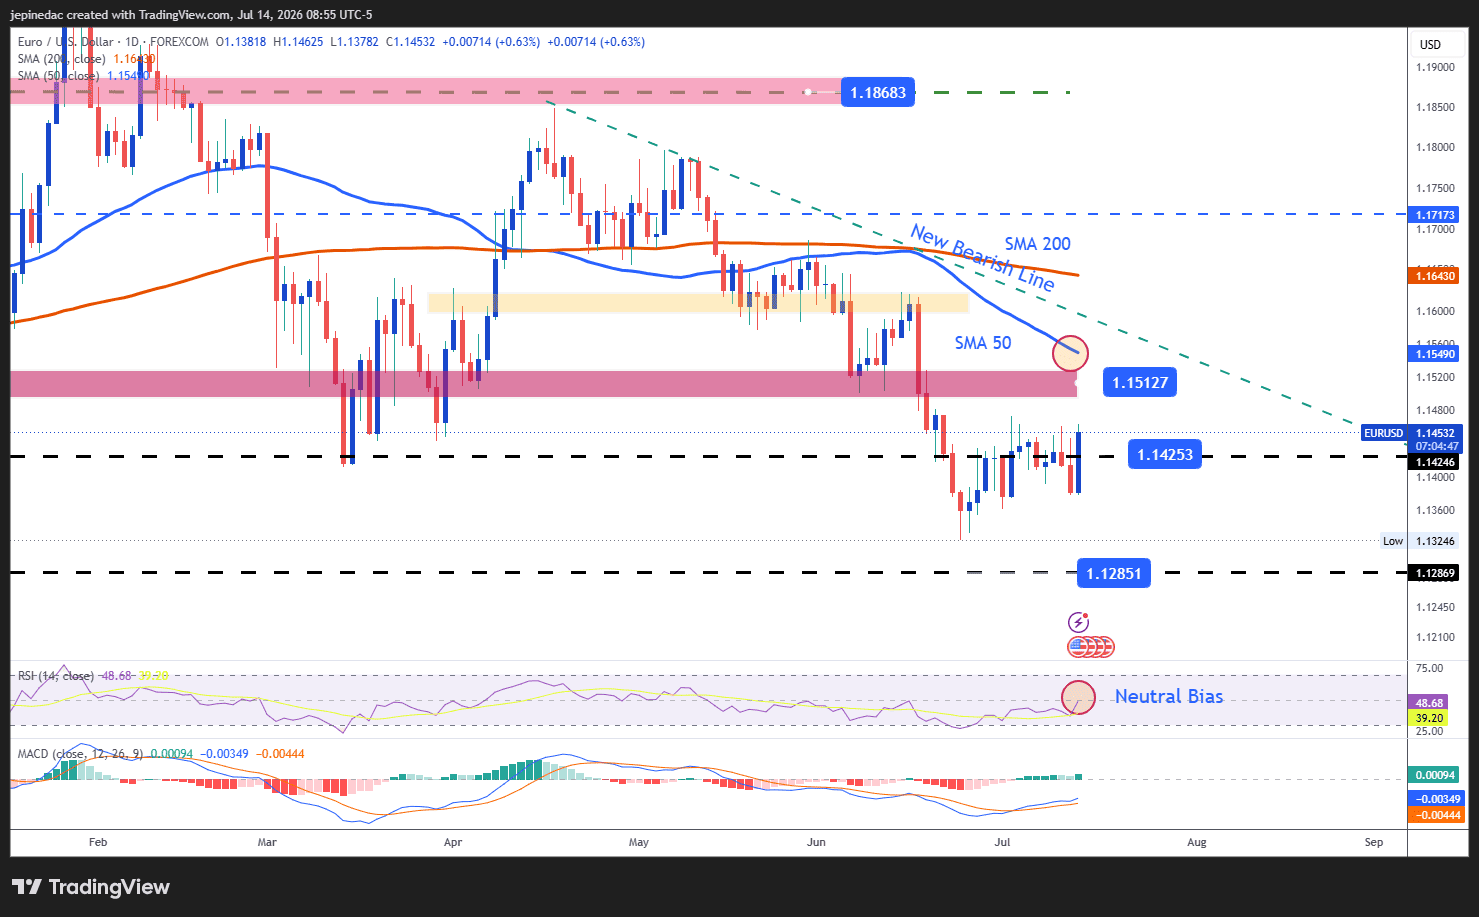
- Recent recovery becomes relevant: Although a long bearish trend line has been present for months in average EUR/USD movements, the recent price recovery has started to weaken the long-term selling bias. This move could be opening room for a more neutral phase on the chart. Even though the bearish trend line has not yet been broken, price could start to stop forming new lows and enter a more consistent range. If this effect continues over the next few sessions and selling pressure fails to stabilize again, the continuation of the bearish trend line on the daily chart could start to come under pressure.
- RSI: Now, the RSI has moved back toward the neutral 50 area. This suggests a balance between buying and selling impulses in the market. Rather than pointing to a clear directional move, the indicator highlights a possible phase of indecision that could remain relevant over the next few sessions.
- MACD: A similar dynamic can be seen in the MACD, whose histogram remains very close to the neutral 0 level. This suggests balance in the average strength of short-term moving averages. This reading may also reflect relevant neutrality in short-term price movements.
Key levels:
- 1.15127 – Relevant resistance: This important high level coincides with a retracement area from previous weeks and also with the barrier formed by the 50-period moving average. Price movements attempting to break above this level could start to put the long bearish trend line at risk and open room for a more dominant buying bias over the coming weeks.
- 1.14253 – Near-term barrier: This level corresponds to the most relevant neutral area now. Price movements too close to this level could continue to highlight significant indecision and even open room for a possible short-term sideways range over the next few sessions.
- 1.12851 – Definitive support: This level is associated with a neutral area observed in May 2025 and now acts as the main support to watch. If price continues to move closer to this area, the selling bias would be reinforced and the possibility of an extension of the bearish trend line as the dominant chart structure over the coming weeks would increase.
Written by Julian Pineda, CFA, CMT – Market Analyst
Follow him on: @julianpineda25







Web Trader platform
Our sophisticated web-based platform is packed with features.
Open an account today
Experience award-winning platforms with fast and secure execution.
Economic calendar
Related articles

Euro Short-term Outlook: EUR/USD Pullback Nears Pivotal Uptrend Support 8 28 2026
Warsh's comments accelerated the EUR/USD selloff, raising the stakes as buyers look to stabilize the broader recovery.


Nasdaq 100 Forecast: NDX slips ahead of Fed Chair Warsh’s speech
U.S. stocks are edging lower on Friday, giving back some of yesterday's gains after Nvidia's strong outlook revived the tech trade. The focus has now shifted firmly to Fed Chair Kevin Warsh's Jackson Hole speech, with investors looking for more clarity on the outlook for interest rates.


EUR/USD forecast: All eyes on Warsh at Jackson Hole - Forex Friday
For much of this week, the EUR/USD has been edging lower with the US dollar regaining some ground after last week’s sell-off that was triggered, in part, by the bond market worries. Investors have been unwilling to bet further against the US dollar so far this week ahead of Kevin Warsh’s keynote speech at the Jackson Hole summit, due later today.
