



EUR/USD Vulnerable on Close Below 50-Day SMA
A close below the 50-Day SMA (1.1040) may warn of a further decline in EUR/USD as it no longer responds to the positive slope in the indicator.
Written by
David Song
Strategist
US Dollar Outlook: EUR/USD
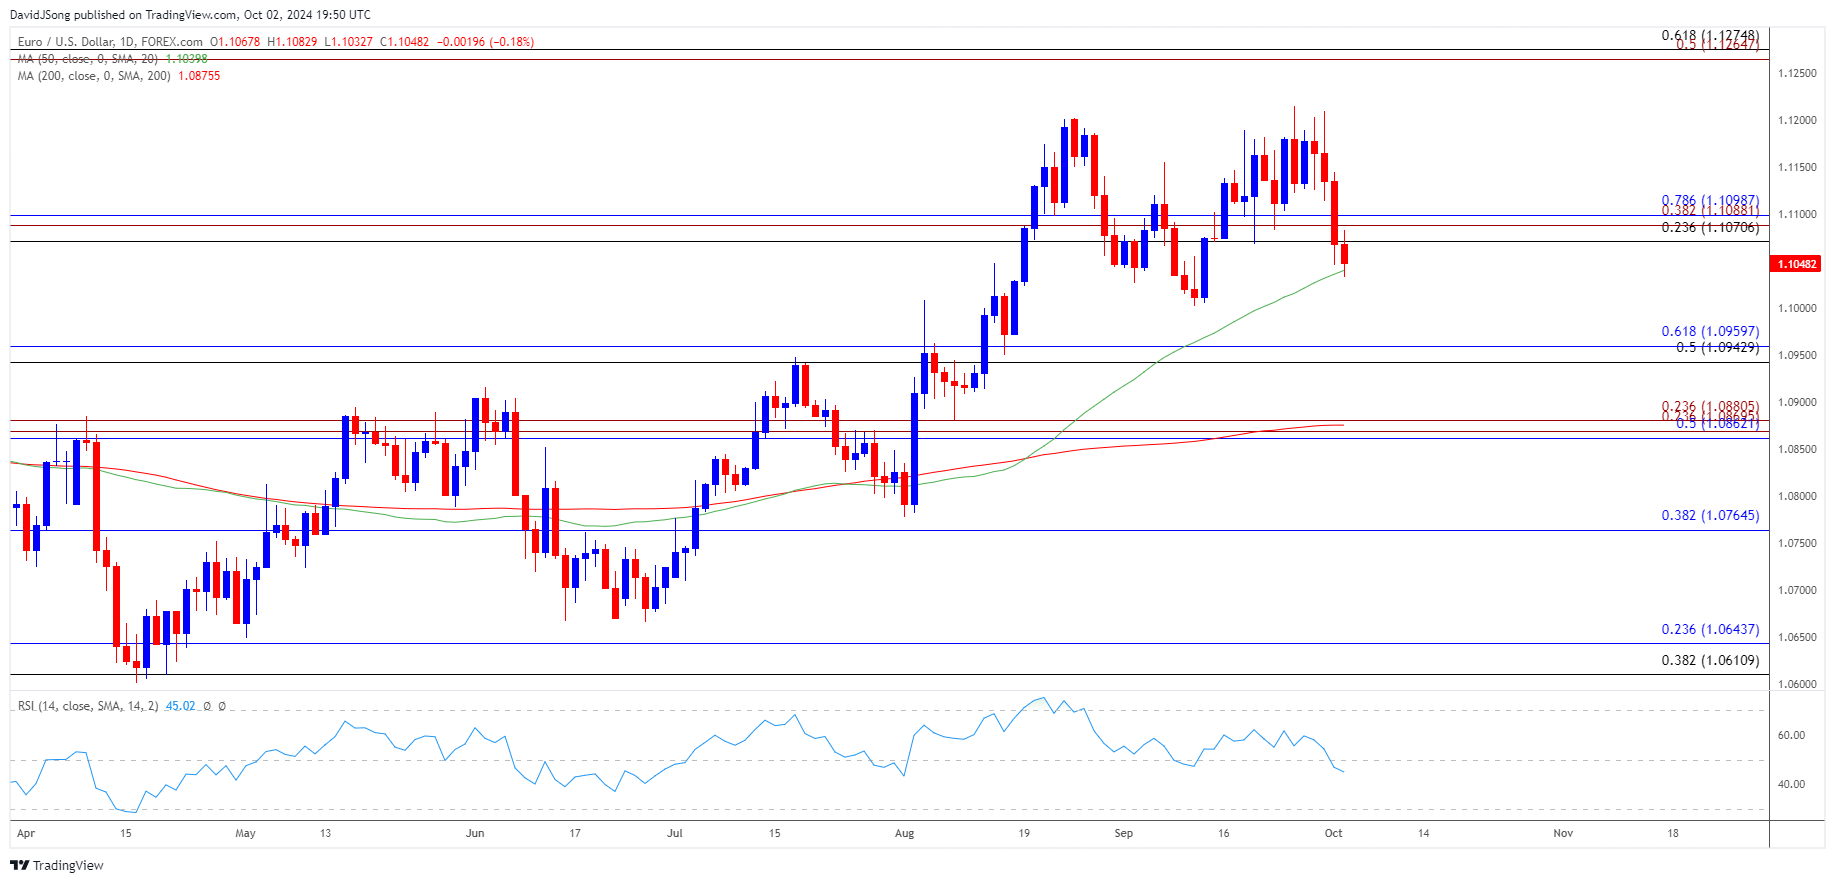
EUR/USD slips to a fresh weekly low (1.1033) as the ADP Employment report shows a 143K rise in September versus forecasts for a 120K print, and a close below the 50-Day SMA (1.1040) may warn of a further decline in the exchange rate as it no longer responds to the positive slope in the indicator.
EUR/USD Vulnerable on Close Below 50-Day SMA
The opening range for October is in focus for EUR/USD as signs of a resilient US labor market casts doubts for another 50bp Federal Reserve rate cut, and the exchange rate may continue to give back the advance from the September low (1.1002) as it carves a series of lower highs and lows.
Meanwhile, the European Central Bank (ECB) may come under pressure to further support the Euro Area as the Consumer Price Index (CPI) narrows more-than-expected in September, with the headline reading falling to 1.8% from 2.2% per annum the month prior.
At the same time, the core CPI slipped to 2.7% from 2.8% during the same period, and evidence of easing inflation may push the ECB to deliver another 25bp rate cut as the Governing Council pledges to ‘follow a data-dependent and meeting-by-meeting approach to determining the appropriate level and duration of restriction.’
With that said, the Euro may face headwinds ahead of the next ECB meeting on October 17 as inflation falls below 2% for the first time since 2021, but the exchange rate may hold within the September range if it struggles to close below the 50-Day SMA (1.1040).
EUR/USD Chart – Daily
Chart Prepared by David Song, Strategist; EUR/USD on TradingView
- EUR/USD carves a series of lower highs and lows as it trades to a fresh weekly low (1.1033), and a close below the 50-Day SMA (1.1040) may push the exchange rate towards the September low (1.1002).
- Next area of interest comes in around 1.0940 (50% Fibonacci retracement) to 1.0960 (61.8% Fibonacci retracement) but EUR/USD may attempt to track the positive slope in the moving average if it fails to close below the indicator.
- Need a move back above the 1.1070 (23.6% Fibonacci retracement) to 1.1100 (78.6% Fibonacci retracement) area for EUR/USD to negate the bearish price series, with a breach above the monthly high (1.1144) bringing the yearly high (1.1214) on the radar.
--- Written by David Song, Senior Strategist
Follow on Twitter at @DavidJSong
Related tags:
Latest market news








Web Trader platform
Our sophisticated web-based platform is packed with features.
Open an account today
Experience award-winning platforms with fast and secure execution.
Economic calendar
Related articles

EUR/USD, AUD/USD, Gold Weekly Technical Outlook 8 31 2026
Sr. Technical Strategist Michael Boutros highlights the levels that matter on the Euro, Aussie and Gold this week.


Euro Short-term Outlook: EUR/USD Pullback Nears Pivotal Uptrend Support 8 28 2026
Warsh's comments accelerated the EUR/USD selloff, raising the stakes as buyers look to stabilize the broader recovery.

Gold and S&P 500 analysis: What now after Warsh’s hawkish speech?
The dollar surged across the board after the Fed Chair Kevin Warsh surprised with a hawkish-leaning speech at the Jackson Hole summit. All the bearish dollar bets that had been accumulated since last Friday on the back of data weakness and bond market troubles had to be squared and that triggered a short squeeze rally for the dollar. Gold and silver dropped, as a result, as too did bitcoin, while US indices were giving back earlier gains.
