


EUR/USD, AUD/USD, Gold Weekly Technical Outlook 8 31 2026
Sr. Technical Strategist Michael Boutros highlights the levels that matter on the Euro, Aussie and Gold this week.
Written by
Michael Boutros
Sr. Technical Strategist
Euro Price Chart – EUR/USD 240min
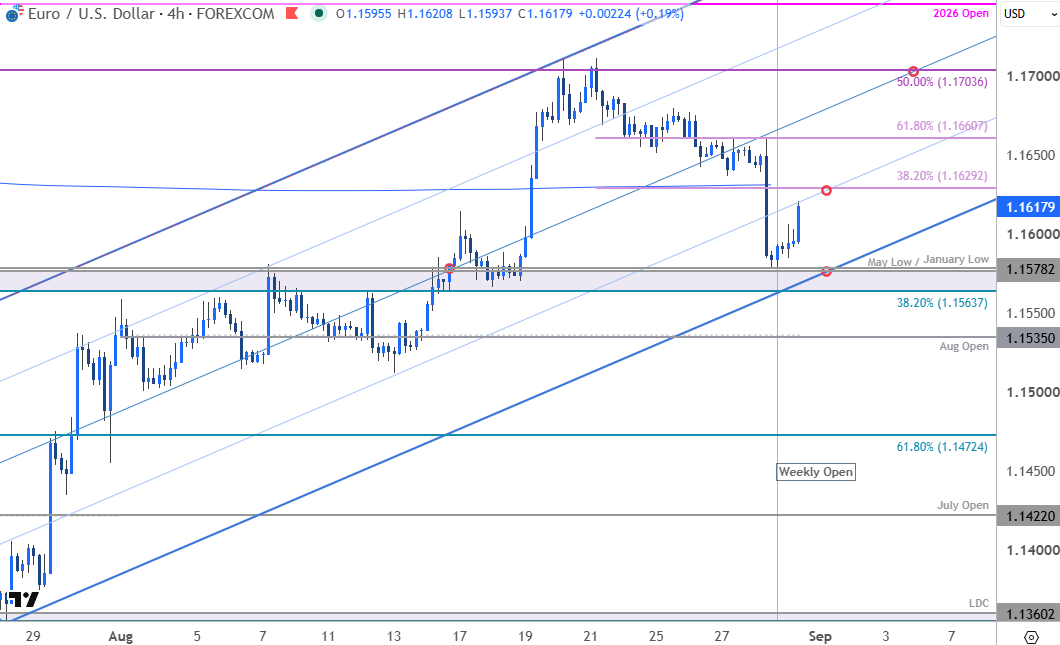
Chart Prepared by Michael Boutros, Sr. Technical Strategist; EUR/USD on TradingView
Notes: Euro rebounded off confluent support into the start of the week at 1.1534/78- a region defined by the 38.2% retracement of the June advance and the May/January swing lows. Note that the lower parallel of the July uptrend converges on this zone over the next few days and losses below this threshold would be needed to suggest a more significant near-term high is in place, and a larger trend reversal is underway. Subsequent support objectives rest with the August open at 1.1535 and the 61.8% retracement at 1.1472.
Initial resistance is eyed at the 38.2% retracement of the recent decline which converges on the 200-day & 52-week moving averages and the 25% parallel of the upslope near 1.1630/31. A breach / daily close above this threshold would threaten trend resumption with subsequent resistance objectives eyed at the 61.8% retracement at 1.1661 and the 50% retracement of the yearly range near 1.1704. Look for a larger reaction there IF reached.
Bottom line: EUR/USD is testing confluent uptrend support early in the week. From a trading standpoint, losses would need to be limited to 1.1563 IF price is heading higher on this stretch with a close above 1.1630 needed to fuel the next leg of the advance. Stay nimble into the monthly cross and watch the weekly close for guidance here.
Australian Dollar Price Chart – AUD/USD 240min
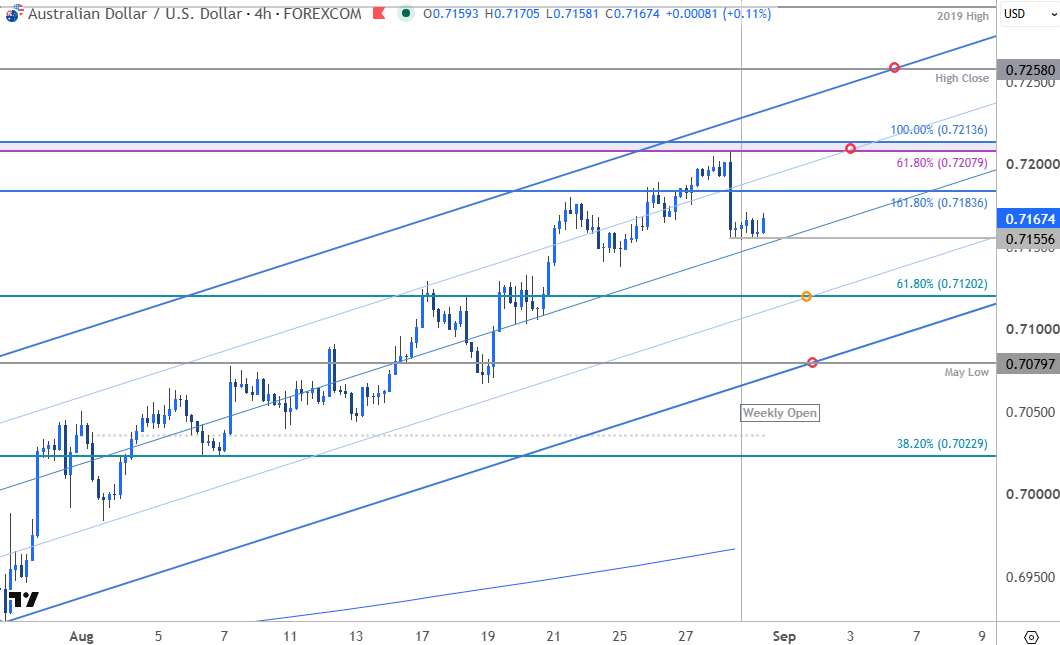
Chart Prepared by Michael Boutros, Sr. Technical Strategist; AUD/USD on TradingView
Notes: Aussie marked an outside daily-reversal off confluent resistance on Friday at 7208/14- a region defined by the 61.8% retracement of the 2021 decline and the 100% extension of the 2025 advance. AUD/USD is trading just above support into the monthly close, with the late-July uptrend median converging on Friday’s low near 7155. The immediate focus into the start of the week is on a breakout of Friday’s range with initial resistance eyed at 7184. Ultimately a topside breach above 7214 would be needed to mark resumption of the uptrend towards the upper parallel. Note that the yearly high-close converges on this slope into the close of the week at 7258.
A break below the median-line would threaten a larger pullback within the monthly uptrend. Subsequent support rests with the 61.8% retracement of the May decline at 7120 with broader bullish invalidation steady at the May low at 7080. A break / daily close below this threshold would be needed to suggest a more significant near-term high is in place, and a larger trend reversal is underway.
Bottom line: A reversal off technical resistance is testing uptrend support at the median-line into the stat of the week and the focus is on a reaction off this slope. From a trading standpoint, losses would need to be limited to 7080 for the uptrend to remain viable heading into September with a breach / daily close above 7214 needed to fuel the next major leg of the advance. Event risk out of Australia is limited this week so watch USD performance and broader risk sentiment for guidance here.
Gold Price Chart – XAU/USD Daily
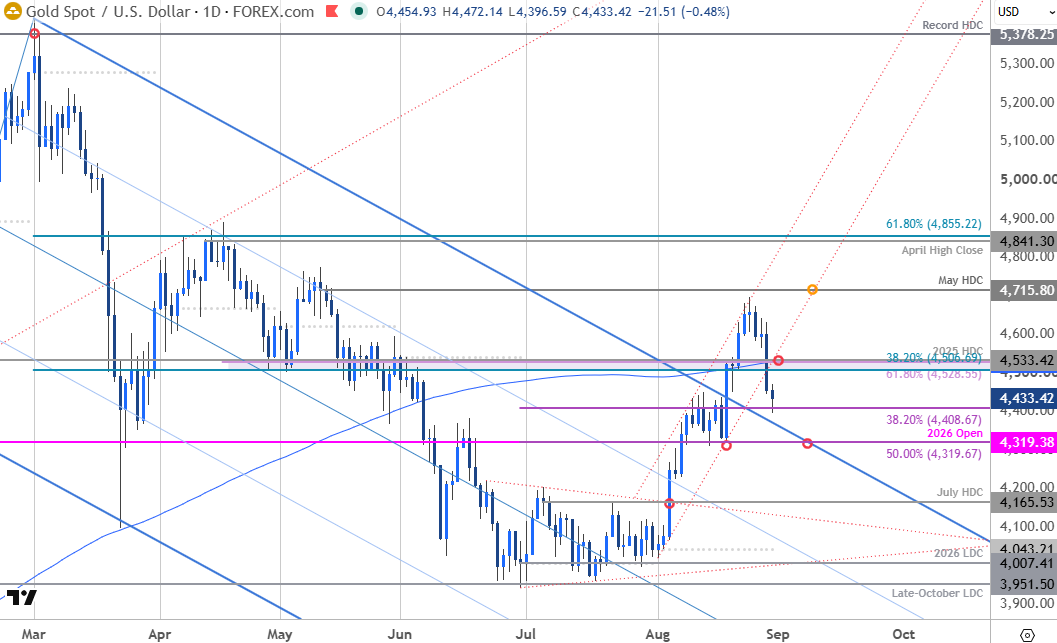
Chart Prepared by Michael Boutros, Sr. Technical Strategist; XAU/USD on TradingView
Notes: Gold broke below the August uptrend on Friday after Fed Chair Warsh’s hawkish remarks at the Jackson Hole World Economic Symposium. The decline has extended more than 6.3% off the monthly high with XAU/USD trading just above the 38.2% retracement of the late-Jun advance today at 4409. Key support now rests with the objective yearly open and the 50% retracement at 4319/20. Losses below this threshold would invalidate the breakout of the March downtrend and threaten further losses heading into September.
Key resistance is now eyed back at 4507/33- a region defined by the 38.2% retracement of the April decline, the 61.8% retracement of the March decline, the 2025 high-day close (HDC), and the 200-day moving average. A topside breach / close above this pivot zone is needed to fuel the next leg of the recovery with subsequent resistance eyed at the May HDC at 4716 and the April high-close / 61.8% retracement at 4841/55- look for a larger reaction there IF reached.
Bottom line: A break below the multi-week tilts the near-term risk to the downside and the bulls will need to stabilize this decline in the days ahead for the broader breakout to remain viable. From a trading standpoint, losses would need to be limited to the 4319 IF gold is heading higher in the weeks ahead with a close above 4533 needed to fuel the next major leg of the advance. A break / daily close below the yearly open would threaten resumption of the March downtrend.
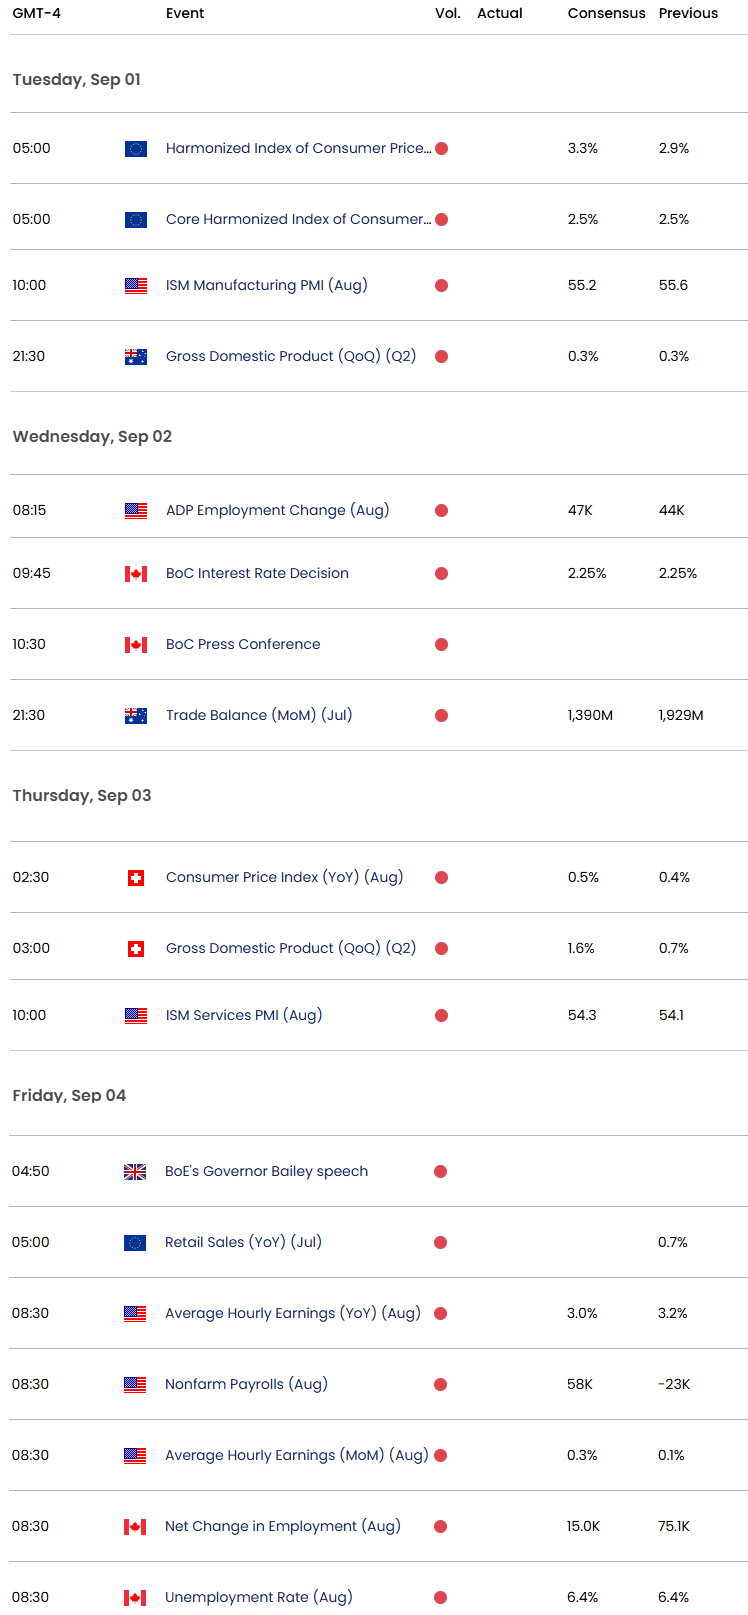
Economic Calendar – Key Data Releases
--- Written by Michael Boutros, Senior Technical Strategist
Follow Michael on X @MBForex
Latest market news











Web Trader platform
Our sophisticated web-based platform is packed with features.
Open an account today
Experience award-winning platforms with fast and secure execution.
Economic calendar
Related articles

Gold and S&P 500 analysis: What now after Warsh’s hawkish speech?
The dollar surged across the board after the Fed Chair Kevin Warsh surprised with a hawkish-leaning speech at the Jackson Hole summit. All the bearish dollar bets that had been accumulated since last Friday on the back of data weakness and bond market troubles had to be squared and that triggered a short squeeze rally for the dollar. Gold and silver dropped, as a result, as too did bitcoin, while US indices were giving back earlier gains.


EUR/USD forecast: All eyes on Warsh at Jackson Hole - Forex Friday
For much of this week, the EUR/USD has been edging lower with the US dollar regaining some ground after last week’s sell-off that was triggered, in part, by the bond market worries. Investors have been unwilling to bet further against the US dollar so far this week ahead of Kevin Warsh’s keynote speech at the Jackson Hole summit, due later today.

Bitcoin Forecast: BTC/USD Back to $80K Ahead of Warsh’s Jackson Hole Speech
After surging over $15,000 in the past 10 days alone, there is risk of a near-term pullback if Warsh says anything remotely hawkish at Jackson Hole - what are the levels to watch from here?
