


GBP/USD, AUD/USD, USD/CAD Weekly Technical Outlook
Sr. Technical Strategist Michael Boutros highlights the levels that matter on Sterling, Aussie & Loonie charts this week.
Written by
Michael Boutros
Sr. Technical Strategist
Weekly Technical Trade Levels on Key USD Majors this Week
British Pound Price Chart – GBP/USD 240min
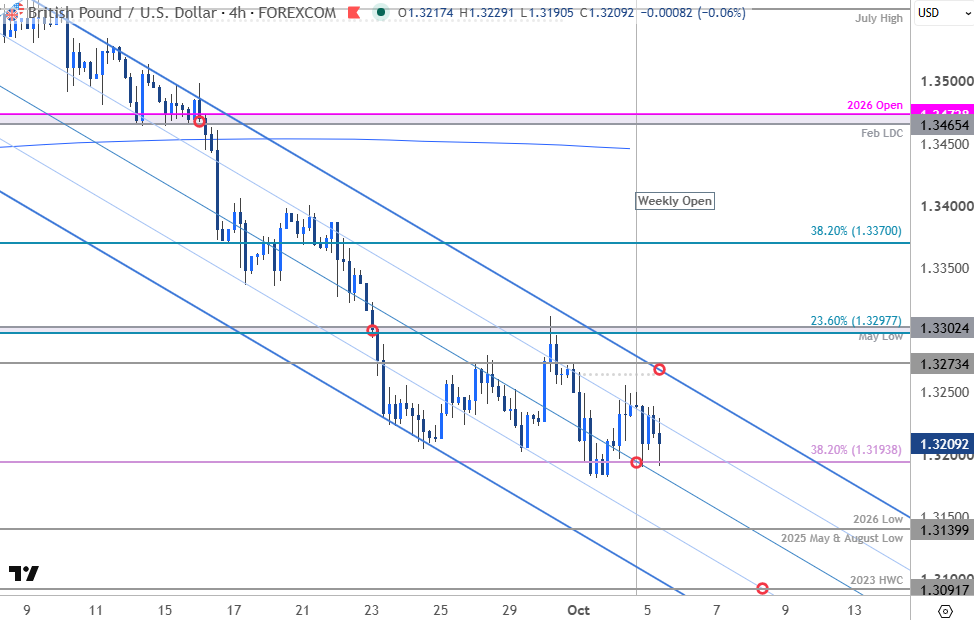
Chart Prepared by Michael Boutros, Sr. Technical Strategist; GBP/USD on TradingView
Notes: Sterling is testing critical support into the start of the month at the 2026 low-week close and the 38.2% retracement of the 2025 advance at 1.3194. GBP/USD has been trading within a 3% range since March with this level now converging on basic slope support extending off the November lows. The focus is on possible inflection off this zone with a break / weekly close below needed to mark resumption of the late-August downtrend.
Initial resistance is eyed near the monthly open at 1.3264/73. Note that the upper parallel of the September pitchfork converges on this level tomorrow with key resistance / bearish invalidation seen just higher at the May low and the 23.6% retracement of the August decline at 1.3298-1.3302. A breach / daily close above this threshold would be needed to suggest a more significant near-term low is in place, and a larger trend reversal is underway.
A break below this key support zone would threaten resumption of the multi-week downtrend and validate a break of the yearly opening-range. Subsequent support objectives rest at the yearly low and the 2025 May & August lows at 1.3140 backed by the 2023 high-week close (HWC) at 1.3092.
Bottom line: GBP/USD is testing critical support here at the lower bounds of the yearly range with the October opening-range taking shape just above. From a trading standpoint, a good zone to reduce short-exposure / lower protective stops- rallies would need to be limited to 1.3273 IF Sterling is heading lower on this stretch with a weekly close below 1.3194 needed to fuel the next major leg of the decline. UK data is limited so be watch the US Dollar price action for guidance this week.
Australian Dollar Price Chart – AUD/USD 240min
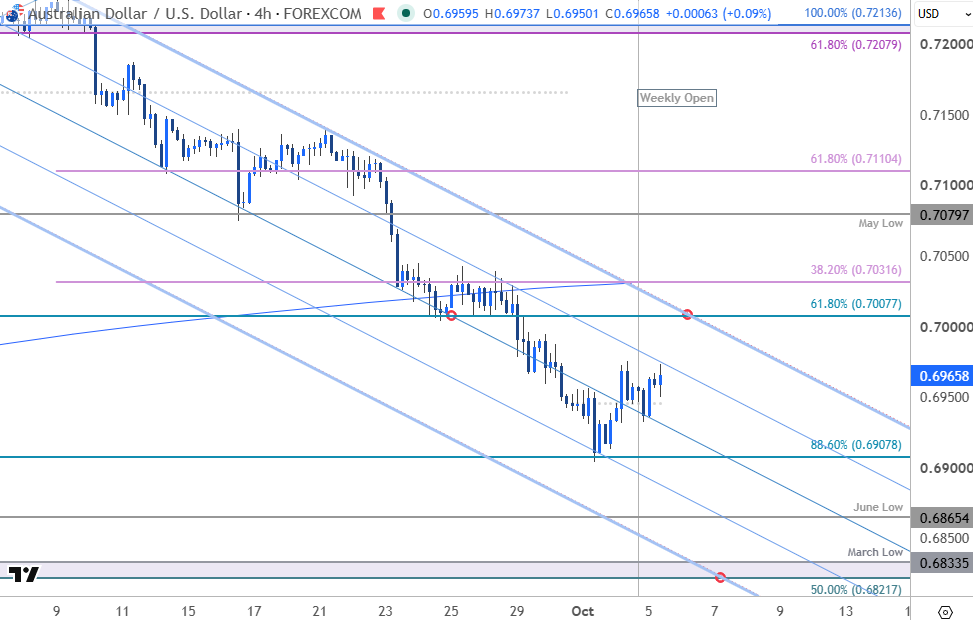
Chart Prepared by Michael Boutros, Sr. Technical Strategist; AUD/USD on TradingView
AUD/USD responded to confluent support last week at the 88.6% retracement of the June advance and the 25% parallel of the September pitchfork at 6908. The recovery has extended more than 1% off the low with Aussie now testing initial resistance at the 75% parallel. Intraday momentum has flat-lined and the focus is on whether the bulls can establish and confirm a more durable low here after falling more than 4.6% off the September high.
Resistance is eyed with the 61.8% retracement at 7008 with bearish invalidation now lowered to the 200-day moving average and the 38.2% retracement of the September decline at 7032. A breach / daily close above this threshold would be needed to suggest a more significant low is in place, and a larger reversal is underway. Subsequent resistance eyed the May low at 7080 and the 61.8% retracement at 7110.
A break lower from here would mark downtrend resumption and threaten another bout of Aussie losses towards the June low at 6865 and the 50% retracement of the November rally and the march low at 6822/33. Look for a larger reaction there IF reached.
Bottom line: AUD/USD recovery is approaching downtrend resistance after rebounding off confluent support last week. From a trading standpoint, rallies would need to be limited to 7008 IF price is head lower on this stretch with a close below 6908 needed to fuel the next major leg of the decline.
Canadian Dollar Price Chart – USD/CAD 240min
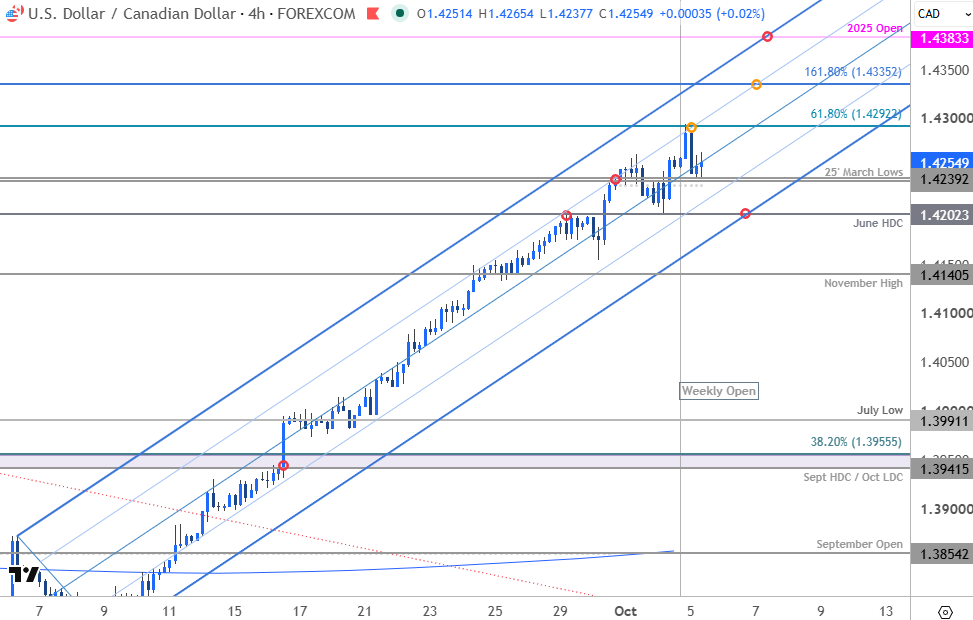
Chart Prepared by Michael Boutros, Sr. Technical Strategist; USD/CAD on TradingView
If USD/CAD closes in the black today, price will have rallied 16 of-the-past-18 days with the advance extending more than 4$% off the August low. While daily momentum remains deep in overbought territory, intraday RSI has been flagging bearish divergence, and the advance may be vulnerable here at fresh yearly highs.
Key resistance was tested overnight at the 61.8% retracement of the 2025 decline at 1.4292, and the focus is on possible inflection off this zone early in the month. A topside breach / daily close above is needed to mark uptrend resumption towards subsequent objectives at the 1.618% extension of the late-January advance at 1.4335 and the 2025 yearly open at 1.4383. Note that this level converges on the upper parallel of the September pitchfork into Wednesday / Thursday- look for a larger reaction there IF reached.
Initial support rests with the 2025 March swing lows at 1.4235/39 and is backed by the June high-day close (HDC) / Friday’s low at 1.4202. The lower parallel converges on this zone Tuesday / Wednesday this week and a break / daily close below would suggest that a more significant high is in place and a larger reversal is underway. Subsequent support rests with the November swing high at 1.4140.
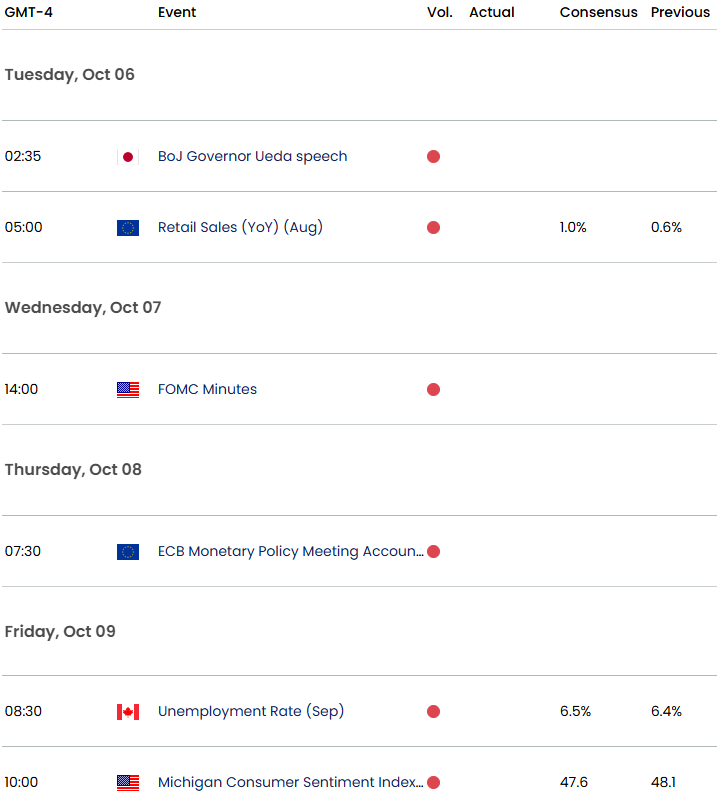
Bottom line: USD/CAD is testing major Fibonacci resistance at fresh yearly highs with the near-term momentum profile threatening exhaustion. Form a trading standpoint, losses would need to be limited to the 1.42-handle IF price is heading higher on this stretch with a close above 1.4292 needed to fuel the next major leg of the advance. Keep in mind we get key Canada employment data on Friday followed by the University of Michigan confidence surveys in the US. This is a mature trend, stay nimble early in the month and watch the weekly closes for guidance here.
Economic Calendar – Key Data Releases
--- Written by Michael Boutros, Senior Technical Strategist
Follow Michael on X @MBForex
Latest market news










Web Trader platform
Our sophisticated web-based platform is packed with features.
Open an account today
Experience award-winning platforms with fast and secure execution.
Economic calendar
Related articles

EUR/USD forecast: All eyes on Warsh at Jackson Hole - Forex Friday
For much of this week, the EUR/USD has been edging lower with the US dollar regaining some ground after last week’s sell-off that was triggered, in part, by the bond market worries. Investors have been unwilling to bet further against the US dollar so far this week ahead of Kevin Warsh’s keynote speech at the Jackson Hole summit, due later today.


Bitcoin Forecast: BTC/USD Back to $80K Ahead of Warsh’s Jackson Hole Speech
After surging over $15,000 in the past 10 days alone, there is risk of a near-term pullback if Warsh says anything remotely hawkish at Jackson Hole - what are the levels to watch from here?


DAX, GBP/USD Forecast: Two trades to watch 2708
DAX rises as Nvidia boosts AI trade ahead of Jackson Hole. GBP/USD slips below 1.36 as Fed expectations shift.
