

Gold Breaks Down on Descending Triangle, Sets Up $4k Test
Gold started last week with a strong sell-off but from that move a bounce developed. Bulls could not hold on through the weekly close, however, and the bearish structure remains in-place for XAU/USD.
Written by
James Stanley
Sr. Strategist
Gold Talking Points:
- The descending triangle looked at in last week’s forecast led to breakdown shortly after the weekly open, with prices rushing down to the 4100-4135 zone before finding a bounce.
- Even with Treasury yields continuing to surge, bold put in a sizable bounce, twice re-testing the $4200 level before sellers came in for rejection on Friday.
- At this point there remains the key level below of $4k which held the lows through June and July and that’s what sets up the bigger picture for gold markets as we move deeper into Q4 trade.
Last week started with a bang in gold markets as the descending triangle looked at in last week’s forecast led to a sizable breakdown. In one violent session on Monday, gold prices shed almost 4%, but sellers slowed the push once the 4104-4135 zone came in for a test.
The initial bounce from support was smooth, taking on the form of a bullish channel. But as I had highlighted over Twitter, that bullish channel when coupled with a bearish backdrop set up for a potential bear flag formation, and that led to breakdown after the test of resistance at 4200.
That wasn’t the last test of 4200, however, as another test showed on Friday after Non-farm Payrolls. And, like the first, sellers responded in a big way to push price back down to support at 4135.
Gold Four-Hour Price Chart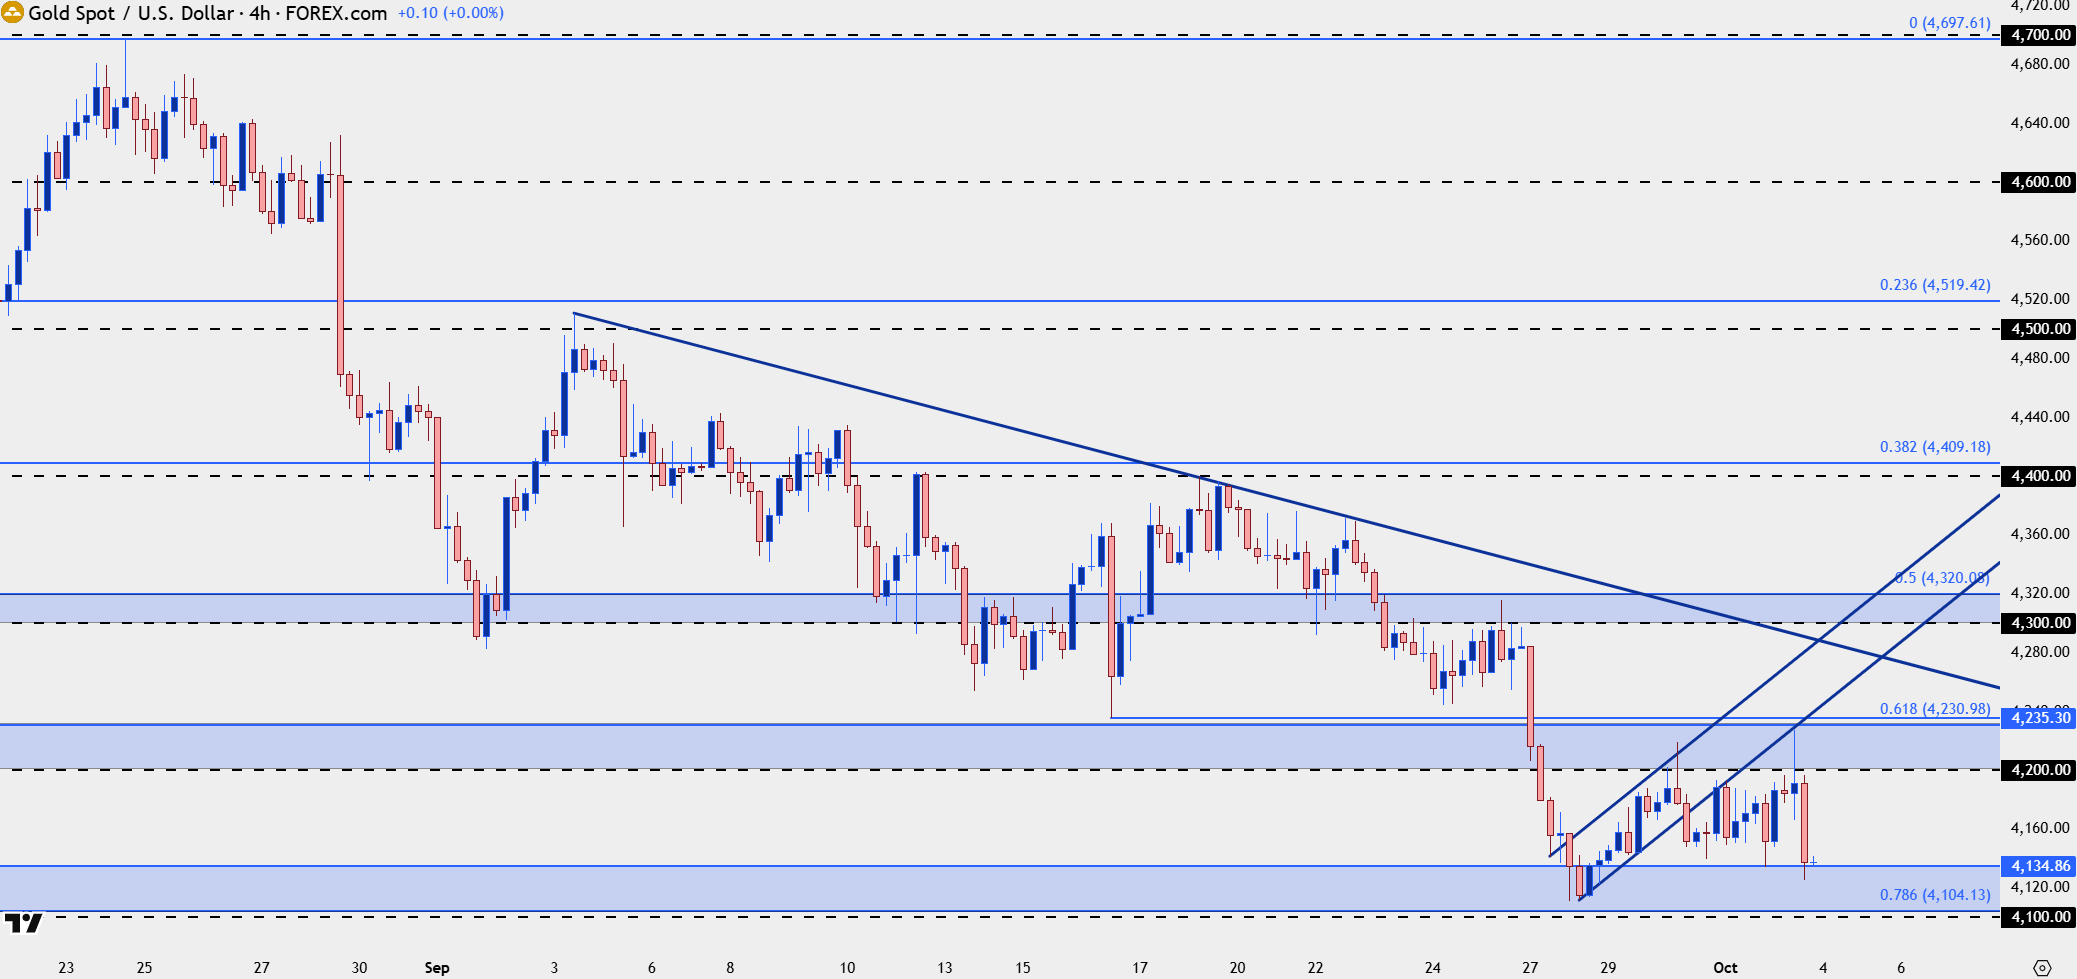
Chart prepared by James Stanley; data derived from Tradingview
Gold – Daily Divergence
The daily chart highlights well the tango taking place in gold, where recent lower-lows and lower-highs point back to that 4k support zone that put up such a rigid fight back in June and July.
There’s even been a hold of higher-lows so far, with sellers unwilling to push through the 4100 level that was previously resistance back in July, just before gold broke out of the falling wedge formation.
Also of interest from the daily chart is the Friday bar, which currently shows as a bearish engulfing pattern. These formations are often followed for continuation in that direction, which in this case would point to a test of $4100 along with breakdown potential into next week.
Gold Daily Chart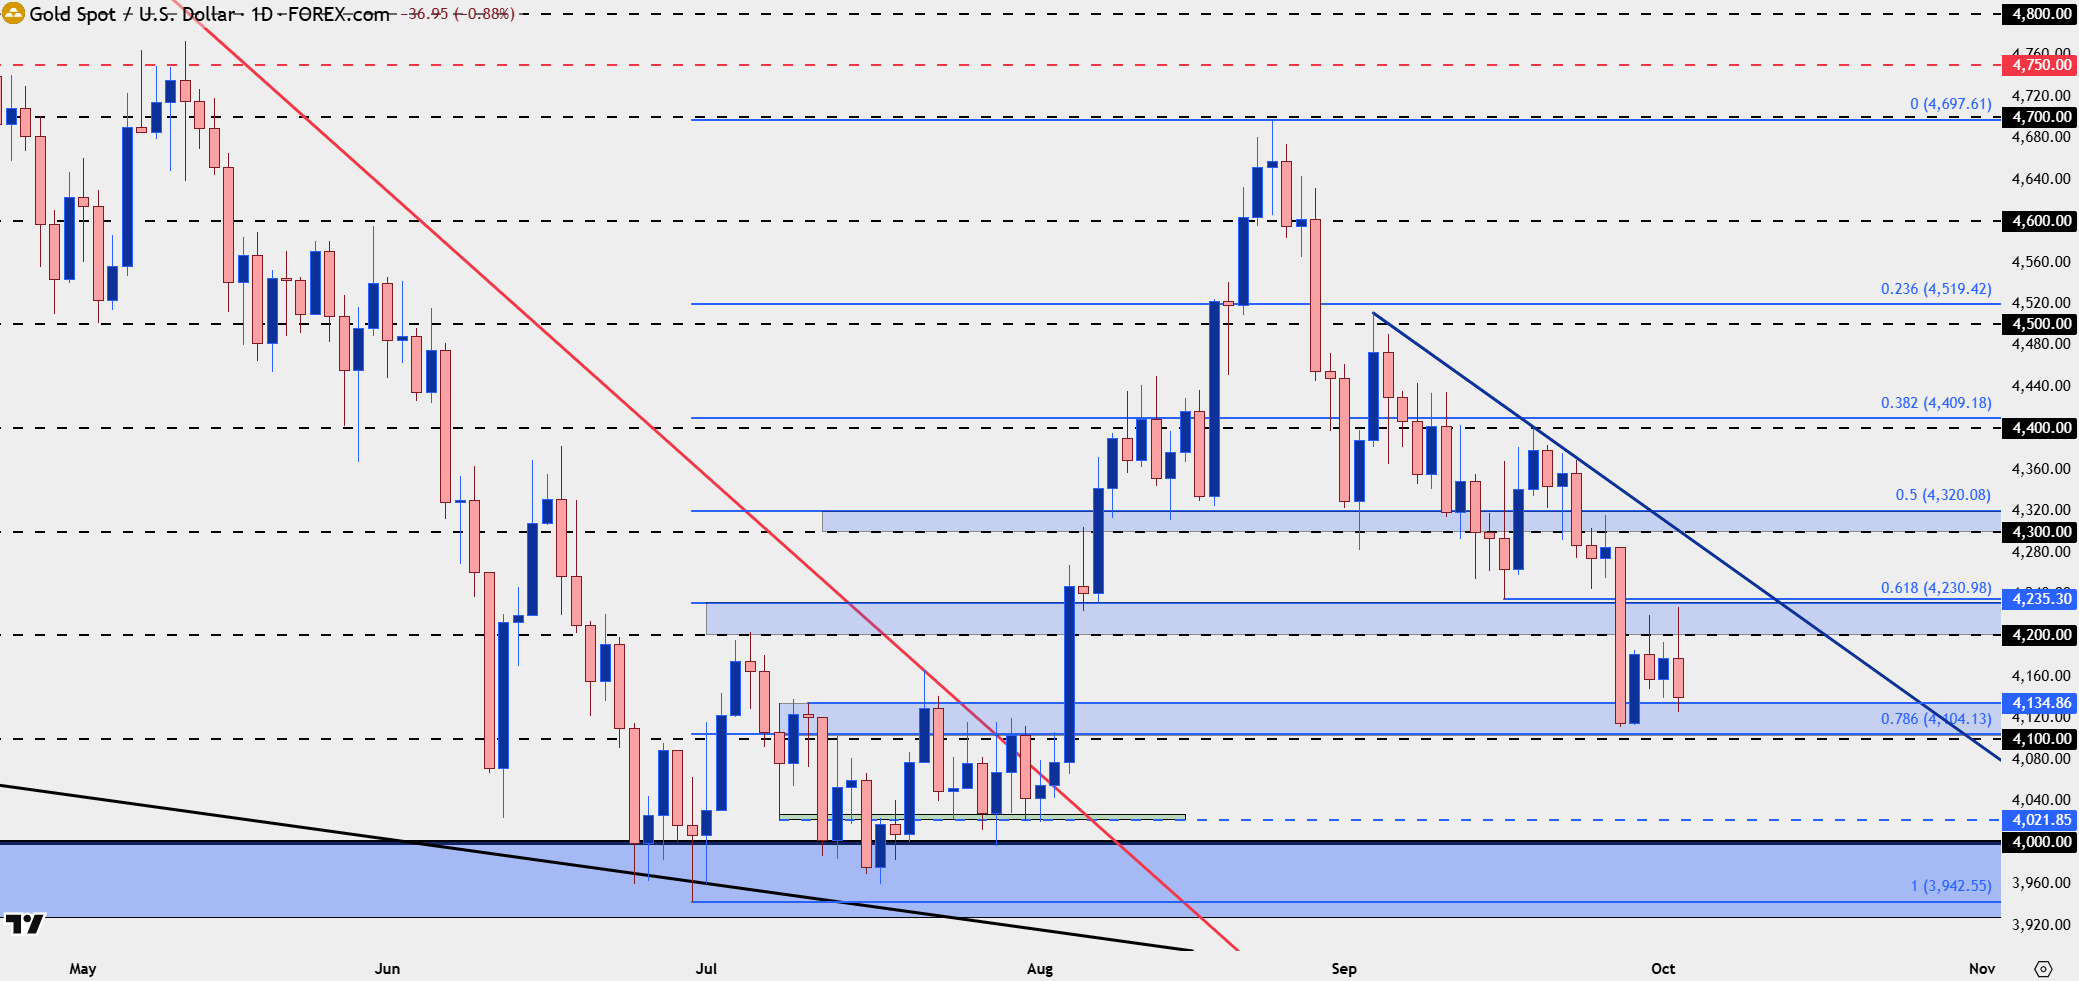
Chart prepared by James Stanley; data derived from Tradingview
Gold Big Picture
The weekly chart sets the stage as it illustrates the importance of that $4k level. This speaks to the prospect of institutional accumulation, which is one of the oft cited reasons for the support hold back in June and July. You’ll notice that not a single weekly candle closed below that $4k level, and that highlights how intra-week tests below $4k can be looked to for short-term bullish reversal potential, even if only for a rally up to a possible lower high.
If and when that zone gives, which could be signified by a weekly close below that price, then the prior support thesis would no longer hold as much attraction, and that would point to bearish continuation potential down to a 3500 re-test, which was last in-play as resistance in 2025, before Jerome Powell signaled his willingness to vote for rate cuts later that year.
Gold Weekly Chart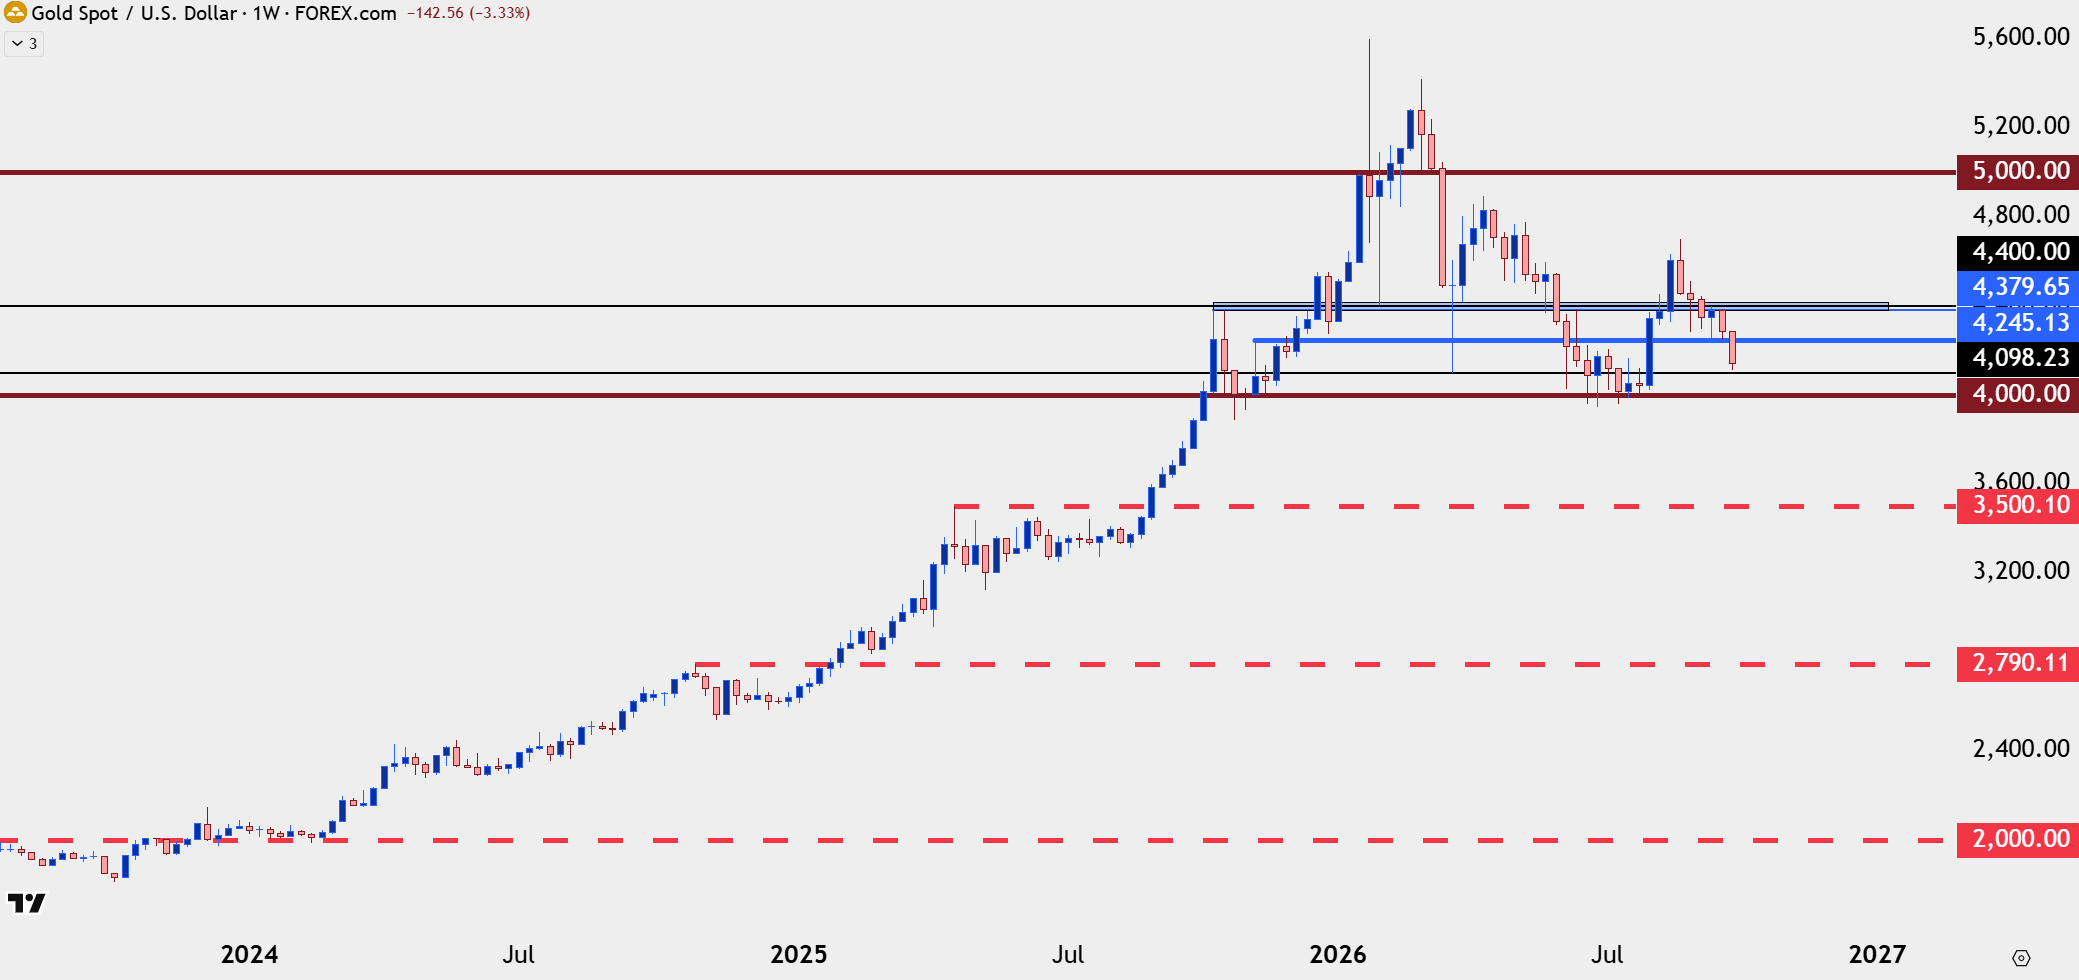
Chart prepared by James Stanley; data derived from Tradingview
--- written by James Stanley, Senior Market Analyst, Global Macro
Related tags:
Latest market news








Web Trader platform
Our sophisticated web-based platform is packed with features.
Open an account today
Experience award-winning platforms with fast and secure execution.
Economic calendar
Related articles

Gold and S&P 500 analysis: What now after Warsh’s hawkish speech?
The dollar surged across the board after the Fed Chair Kevin Warsh surprised with a hawkish-leaning speech at the Jackson Hole summit. All the bearish dollar bets that had been accumulated since last Friday on the back of data weakness and bond market troubles had to be squared and that triggered a short squeeze rally for the dollar. Gold and silver dropped, as a result, as too did bitcoin, while US indices were giving back earlier gains.


Gold Falters at Resistance, Grappling With PCE, Month-End Flows and Jackson Hole
Gold has pulled back from resistance after sticky PCE data, with month-end flows and Jackson Hole now shaping the near-term outlook.


Gold forecast: XAU/USD retreats along with dollar debasement trade
Gold was down nearly 1.5% on the session, with US indices and Bitcoin also struggling. Is this a mere pause before more gains are seen, or have we already seen the end of the recent bullish advance?