


GBP/USD, Dow Jones Forecast: Key Technical Scenarios to Watch
GBP/USD and the Dow Jones are approaching critical technical levels amid earning optimism, Fed rate hike expectations, US-Iran developments, and persistent geopolitical risks.
Written by
Razan Hilal
Market Analyst
The British pound has remained in consolidation since June 2025, with price action forming a potential diamond pattern. This setup raises downside risks for GBP/USD as the US Dollar Index (DXY) continues to hold above its 2026 uptrend while hawkish monetary policy expectations support the US dollar. On the other hand, the Dow is testing new records.
Key Events to Watch
Despite shifting headlines, several macro themes continue to drive market sentiment.
- Crude oil prices remain above key bullish zones for 2026, with WTI holding above $66-$77 and Brent above $70-$80. The resilience in energy prices reflects a persistent geopolitical risk premium and continued inflation concerns.
- Monetary policy expectations also remain supportive of the US dollar. Markets continue to price in a high probability of a Federal Reserve rate hike in September, strengthening the greenback against major currencies and precious metals.
- September rate hike odds remain above 60%.
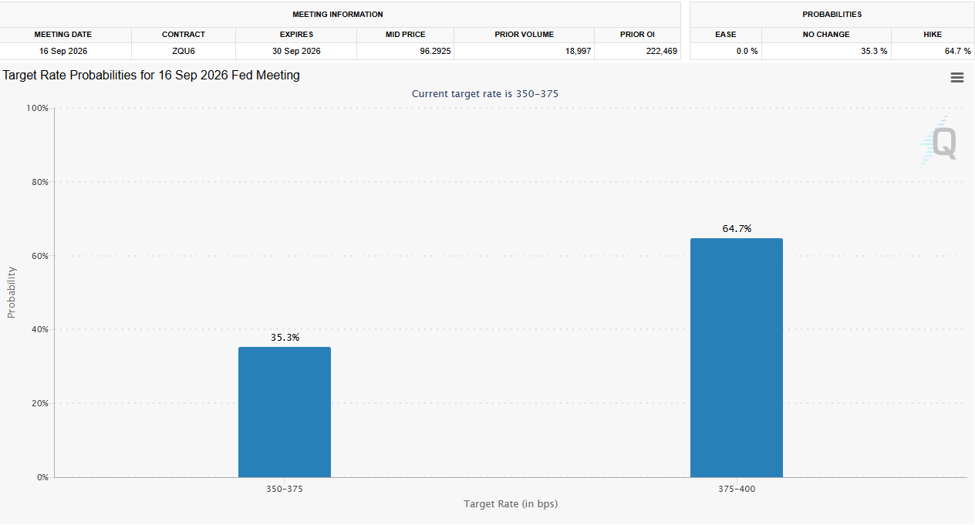
Source: CME FedWatch Tool
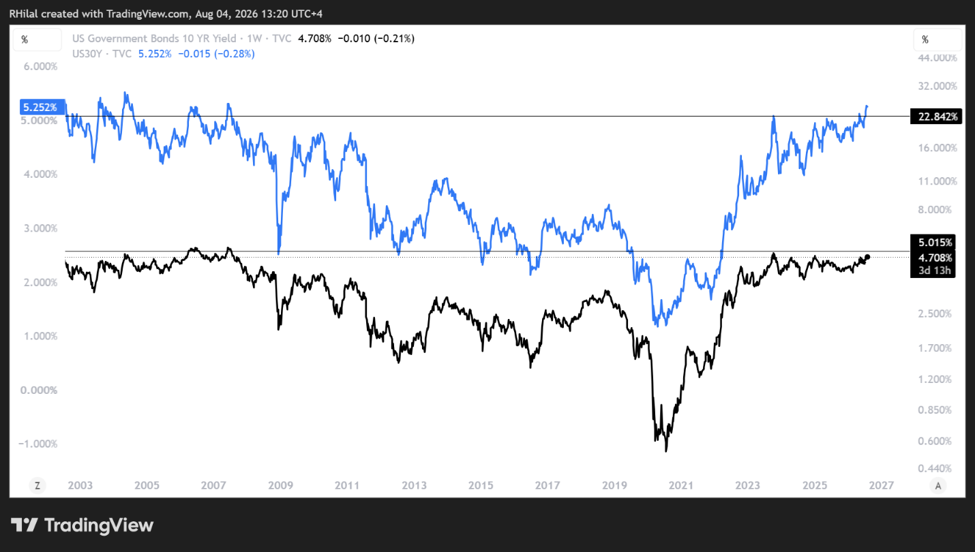
- US Treasury yields continue to trade near multi-year highs, limiting the long-term bullish outlook for equities despite improving economic data and stronger corporate earnings guidance.
US Treasury Yields – Weekly Time Frame (Log Scale)
Source: Trading view
Despite recent optimism, three key factors remain critical in determining whether current market trends can be sustained or whether investors begin pricing in a broader geopolitical escalation or de-escalation scenario.
US Treasury yields remain elevated, with the 30-year yield trading near levels last seen in 2007, while both the 10-year and 2-year yields remain close to their 2025 highs.
The timing of any meaningful shift in market expectations is likely to become evident through price action, particularly as GBP/USD tests the upper boundary of its consolidation range since 2023 while the Dow Jones tests new record highs above 53,500.
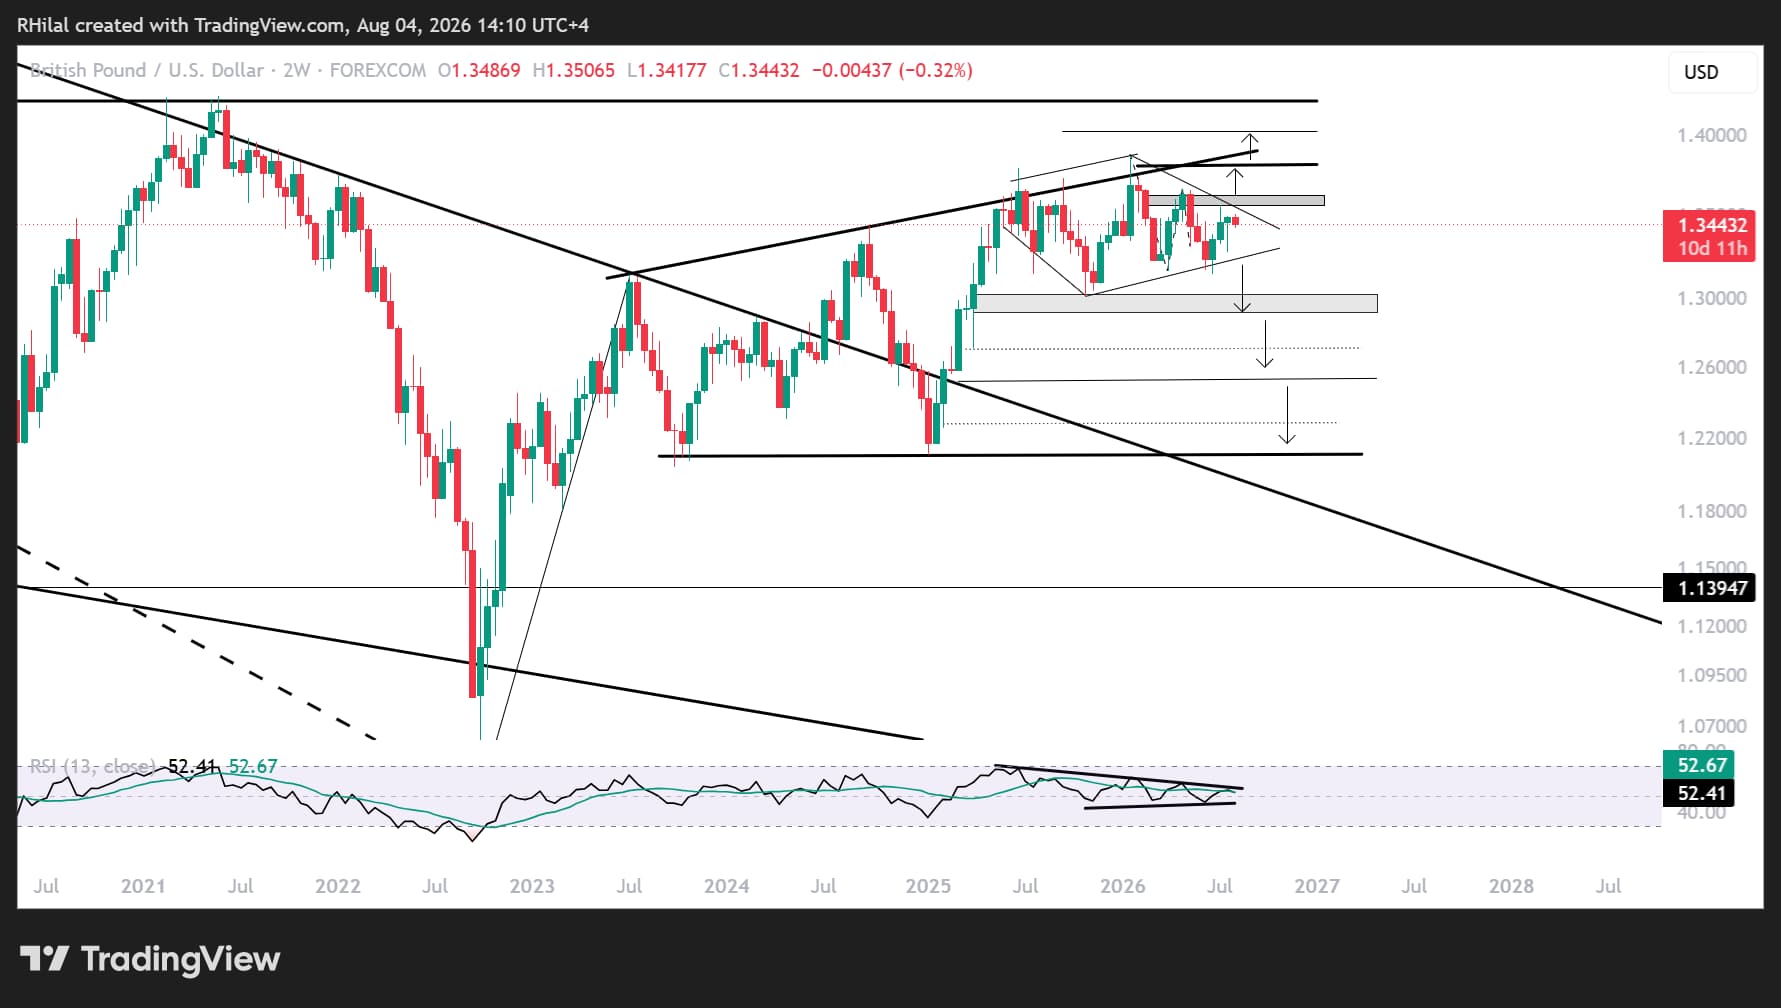
GBP/USD Price Outlook: 2- Week Time Frame (Log Scale)
Source: TradingView
GBP/USD has been trading within a broad consolidation since June 2025, with price action forming a potential diamond pattern alongside a contracting range in the weekly RSI.
This consolidation is developing just below a multi-year ascending resistance trendline dating back to July 2023, creating a significant technical confluence for the pair.
Bullish Scenario
On the upside, GBP/USD is testing the descending resistance connecting the lower highs since January 2026, while the DXY simultaneously tests its ascending support from January 2026, explained in US Dollar (DXY), USD/JPY Forecast: Key Levels to Watch. This resistance also represents the upper boundary of the diamond pattern, located between 1.3560 and 1.3620.
A sustained breakout above the 1.3560–1.3620 resistance zone would expose the long-term ascending resistance from 2023 near 1.3820 for another major test.
If buyers successfully clear that barrier, the pair could extend its long-term bullish trend toward the 2021 and 2018 highs near 1.4200, aligning with the 61.8% Fibonacci extension of the 2025–2026 cycle.
Bearish Scenario
Downside risks remain elevated as the US dollar could strengthen further if the DXY breaks above the 102.00 level amid persistent geopolitical uncertainty. In addition, diamond patterns are often associated with sharp reversals that can mirror the strength of the preceding trend.
A breakdown below 1.3280 followed by 1.3140 would increase confidence in a bearish breakout, exposing the key Fibonacci retracement levels of the 2022–2026 advance.
- 23.6%–27.2%: 1.3040–1.2920
- 38.2%: 1.2530
- 50.0%: 1.2121, where rebound risks could increase as this level aligns with the long-term descending resistance trendline connecting the 2008 and 2025 highs.
The weekly RSI could also provide an early signal of the eventual directional breakout should momentum break decisively higher or lower.
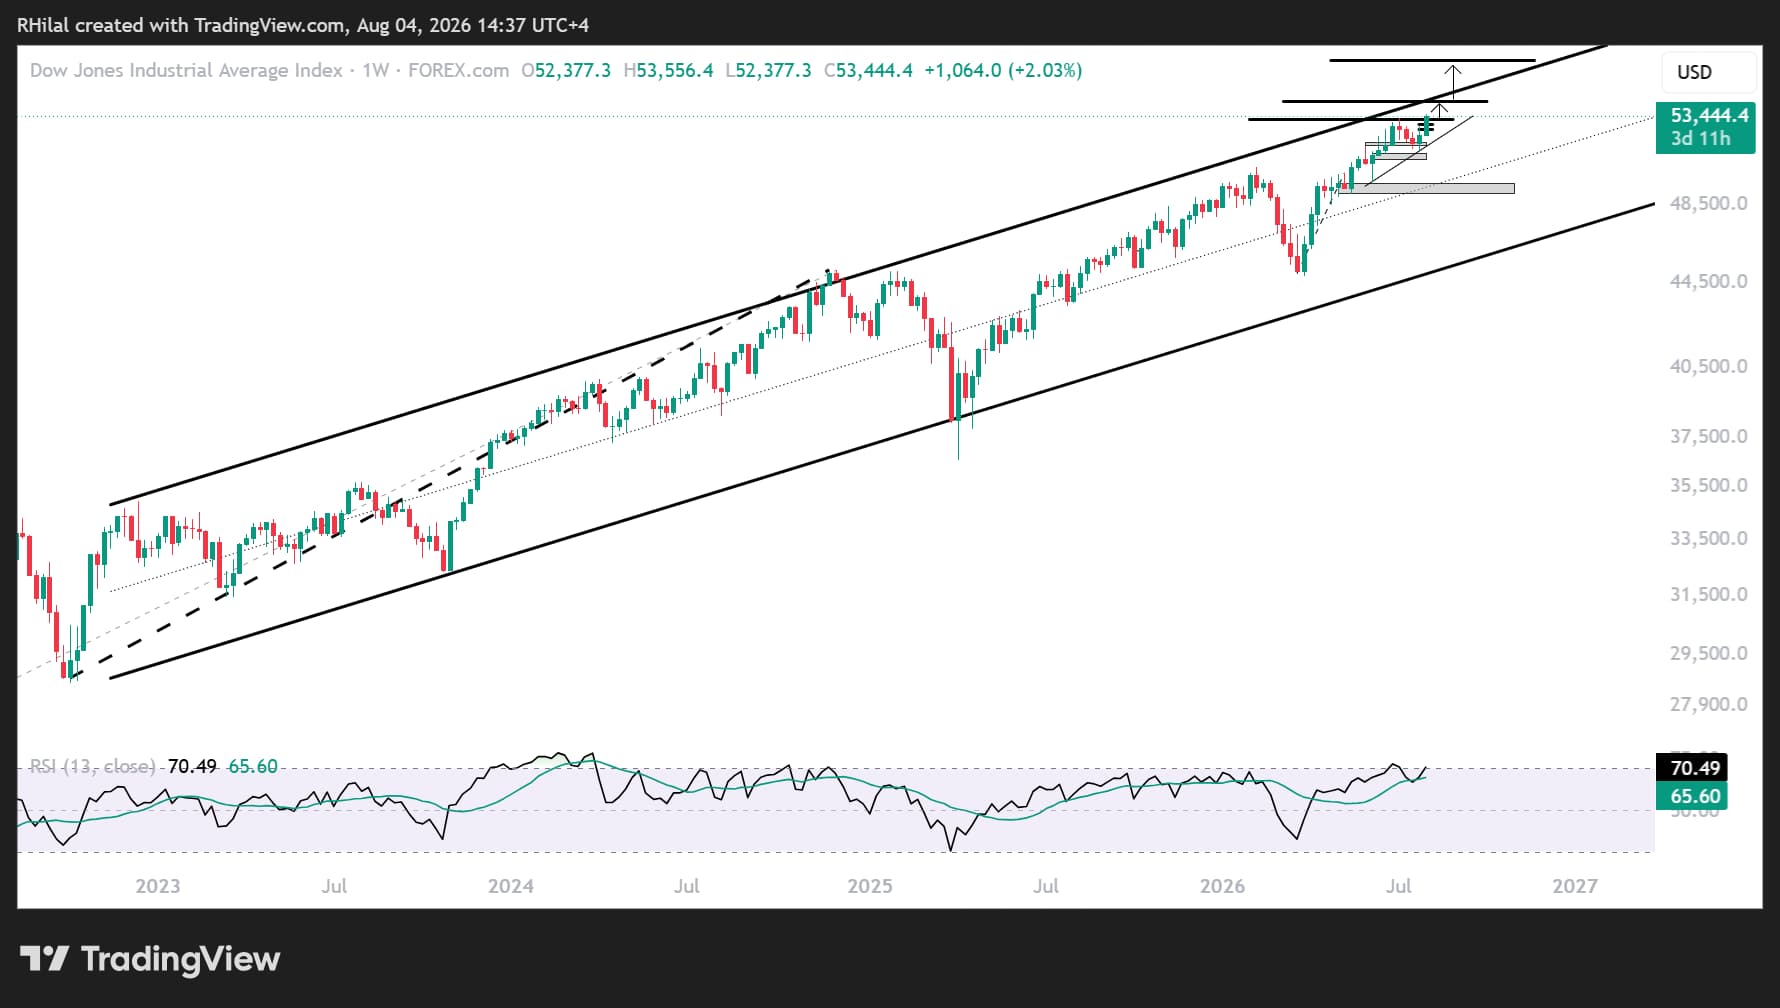
Dow Jones Price Forecast: Weekly Time Frame (Log Scale)
Source: TradingView
The Dow Jones is also trading near an important technical confluence.
The index is positioned close to its all-time high around 53,300, near the upper boundary of a well-defined ascending channel extending from 2022 to 2026, and around the 100% Fibonacci extension of the 2022–2024–2025 cycle.
A breakout above 53,500 would expose the upper boundary of the channel near 54,300–54,500, implying approximately another 1,000-point advance before the next major resistance test. Such a move could either trigger another pullback, consistent with price behavior since 2022, or result in fresh record highs and an extension of the long-term bullish trend.
On the downside, a break below the 53,300–53,100 support area would reinforce the case for a short-term correction toward 52,600 and 52,000, bringing the ascending support trendline from June 2026 into focus before confirming a deeper decline.
Nevertheless, the steep advance into a multi-year resistance zone, combined with overbought weekly momentum, suggests the potential for one final push higher before another corrective phase, particularly as markets continue to price in hawkish monetary policy risks for September.
Written by Razan Hilal, CMT
Follow on X: @Rh_waves







Web Trader platform
Our sophisticated web-based platform is packed with features.
Open an account today
Experience award-winning platforms with fast and secure execution.
Economic calendar
Related articles

Euro Short-term Outlook: EUR/USD Pullback Nears Pivotal Uptrend Support 8 28 2026
Warsh's comments accelerated the EUR/USD selloff, raising the stakes as buyers look to stabilize the broader recovery.


AUD/CAD breakout puts the Bradman barrier in sight
A bullish breakout has pushed AUD/CAD to its highest level since early 2021. Whether it can clear 0.9994 may determine if the move extends well above parity.


Australian Dollar Forecast: AUD/USD Breakout Rally Nears Pivotal Resistance 8 27 2026
Aussie has advanced in eight of the past nine weeks, but the next technical hurdle could determine whether bulls can sustain the broader advance.