

GBP/USD, Oil Forecast: Two trades to watch 300926
GBP/USD: Can Stronger UK Growth Offset the Dollar’s Advantage? Oil: Supply Recovery Challenges the Geopolitical Premium.
Written by
Fiona Cincotta
Senior Market Analyst
GBP/USD: Can Stronger UK Growth Offset the Dollar’s Advantage?
GBP/USD is rising modestly on Wednesday but remains close to its three-month low, having fallen more than 2% across September.
Today’s move higher comes after stronger-than-expected UK GDP data, as U.S. dollar bulls pause for breath.
Data from the Office for National Statistics showed that UK Q2 GDP was upgraded to 0.5% in the three months to June, better than the 0.4% growth seen in the first estimate. This follows growth of 0.6% in Q1.
The data confirms that the UK was the fastest-growing G7 economy in the first half of the year, as consumers continued to spend even as the Middle East conflict lifted oil prices and added to inflationary pressures.
The numbers come as a boost for the Labour Party as it holds its annual conference in Liverpool.
Despite solid GDP growth in Q1 and Q2, the outlook for the second half of the year is darkening, with pressures expected to build on businesses and households. Growth is expected to slow to 0.2% in Q3 and Q4 amid a fresh spike in living costs.
U.S. Yields and Fed Expectations Keep the Dollar in Focus
Meanwhile, the U.S. dollar is pulling back from the two-month high reached yesterday as Treasury yields retreat.
U.S. Treasury yields have pulled back from multi-year highs as oil prices fall to a three-week low, following dovish remarks from New York Fed President John Williams, who warned that the central bank did not need to rush its next move.
U.S. data was also weaker than expected, with Conference Board consumer confidence falling to its lowest level since May 2014, while job openings declined more than expected to 7.09 million.
October Fed rate hike expectations have pulled back from 70% to 40%. However, traders are still pricing in more than a 90% probability that the Fed will raise borrowing costs by the end of the year, which could limit any pullback in the U.S. dollar.
U.S. Inflation and Payrolls Could Decide the Next Move
Attention will now turn to U.S. core PCE, the Fed’s preferred gauge of inflation, which is expected to rise 0.3% month-on-month, up from 0.2%.
The data will be accompanied by final U.S. Q2 GDP data, along with more speeches from Federal Reserve officials. U.S. non-farm payrolls will be released on Friday.
Strong data and hawkish Fed officials could see October rate hike expectations rebound, lifting the U.S. dollar and pulling GBP/USD lower.
The key question for GBP/USD is whether stronger UK growth can offset the widening U.S.-UK yield and policy differential.
If U.S. inflation remains sticky and payrolls are stronger than expected, markets could price out the recent pullback in October rate hike expectations. Higher Treasury yields would then support the dollar and put renewed pressure on GBP/USD.
Conversely, weaker U.S. data combined with continued oil price declines could ease inflation concerns and reduce expectations of further Fed tightening. Lower Treasury yields would weaken the dollar and give GBP/USD more room to recover.
GBP/USD forecast - technical analysis
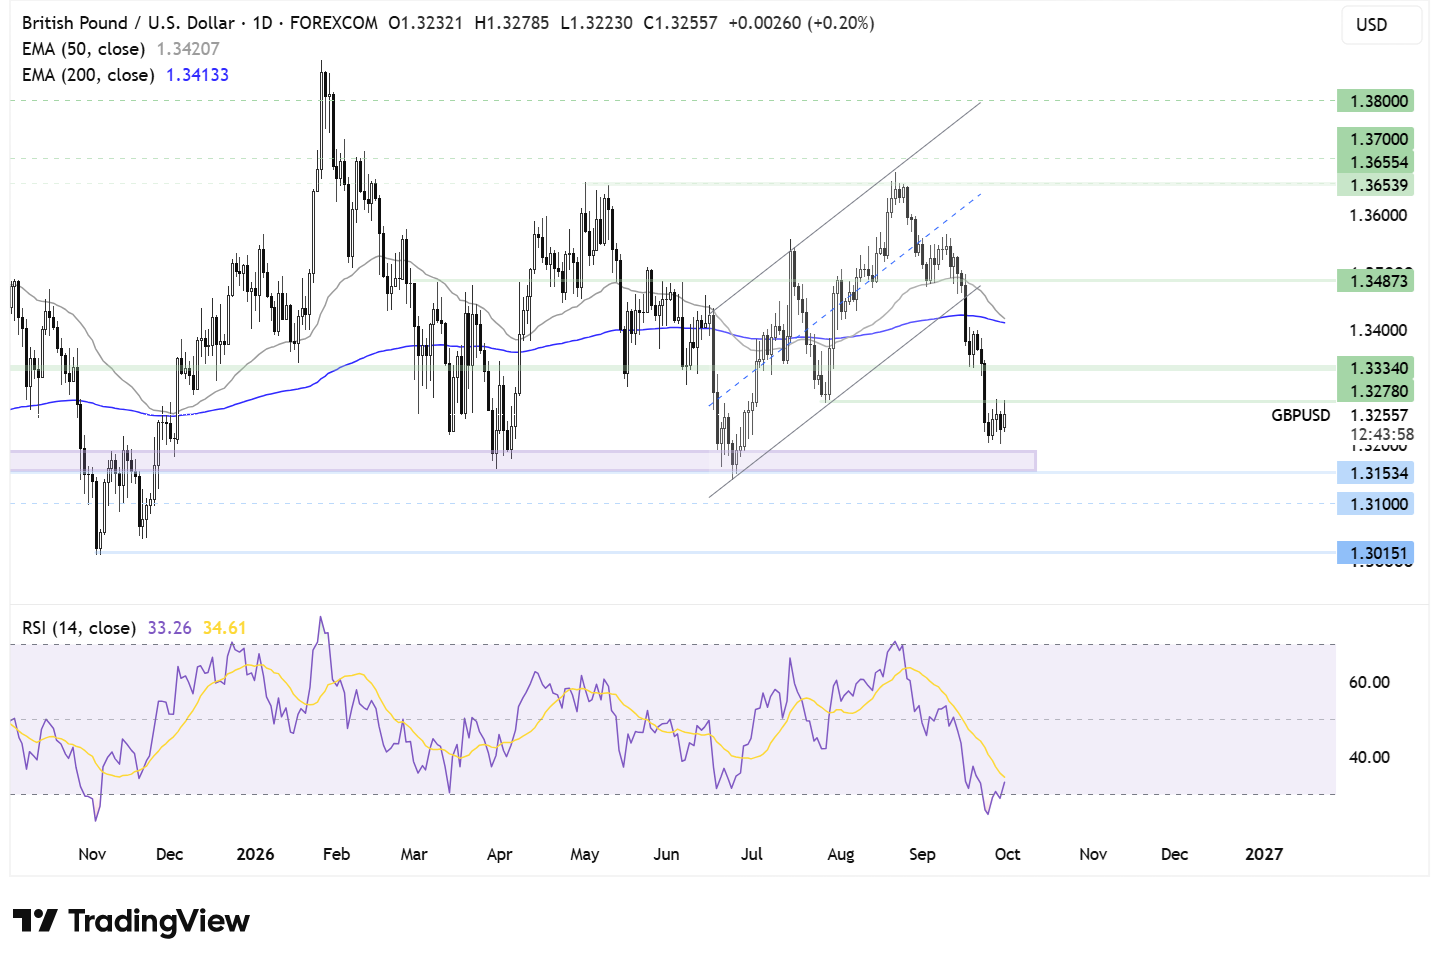
GBP/USD has broken below its rising channel as well as its 50- and 200-day EMAs before finding support around 1.3200. The pair has since recovered slightly and is consolidating around 1.3250, while the RSI has moved out of oversold territory.
The 50 EMA is also close to crossing below the 200 EMA, which would form a bearish death cross.
Sellers will look to break below the 1.3200 support zone to extend the decline towards 1.3100, followed by the psychological 1.3000 level.
On the upside, initial resistance is seen at 1.3275, this week’s high. A break above this level would expose 1.3350, the July 27 swing low, followed by horizontal resistance around 1.3500.
A sustained move above the 50- and 200-day EMAs would put buyers on a firmer footing and bring 1.3500 into focus.
Oil: Supply Recovery Challenges the Geopolitical Premium
Oil prices are drifting modestly higher as President Trump denies that he would be willing to ease sanctions on Iran. Still, gains are muted amid optimism surrounding a recovery in crude supply from the Middle East, which helped pull prices to a three-week low in the previous session.
While Brent is trading above $90 a barrel, the December contract is around $96. Meanwhile, WTI is hovering around $89.
Brent is on track to gain 14% in September, its largest monthly increase since July, while WTI is on track for a more modest 4% rise.
The spread between the two benchmarks is at its widest in four months as markets weigh plans in the U.S. to restrict diesel exports, which could create an oversupply in the U.S. market and lead refiners to produce less crude.
Meanwhile, the picture in the Middle East remains uncertain as Qatar continues its shuttle diplomacy between Tehran and Washington, hoping for a breakthrough.
Although Trump has said he is unwilling to give Iran sanctions relief unless there are concrete steps from Tehran on its nuclear programme, limiting the chances of a diplomatic solution, the impact on oil prices may be limited if crude supply continues to flow.
Crude exports from Middle Eastern producers rebounded in September to 16.32 million barrels per day, the highest since the Iran war began in February. Regional exports are now just 11% below pre-war levels.
That is a remarkable recovery for a region still in conflict. With oil flowing, concerns over supply have eased, putting pressure on prices.
Oil forecast technical analysis
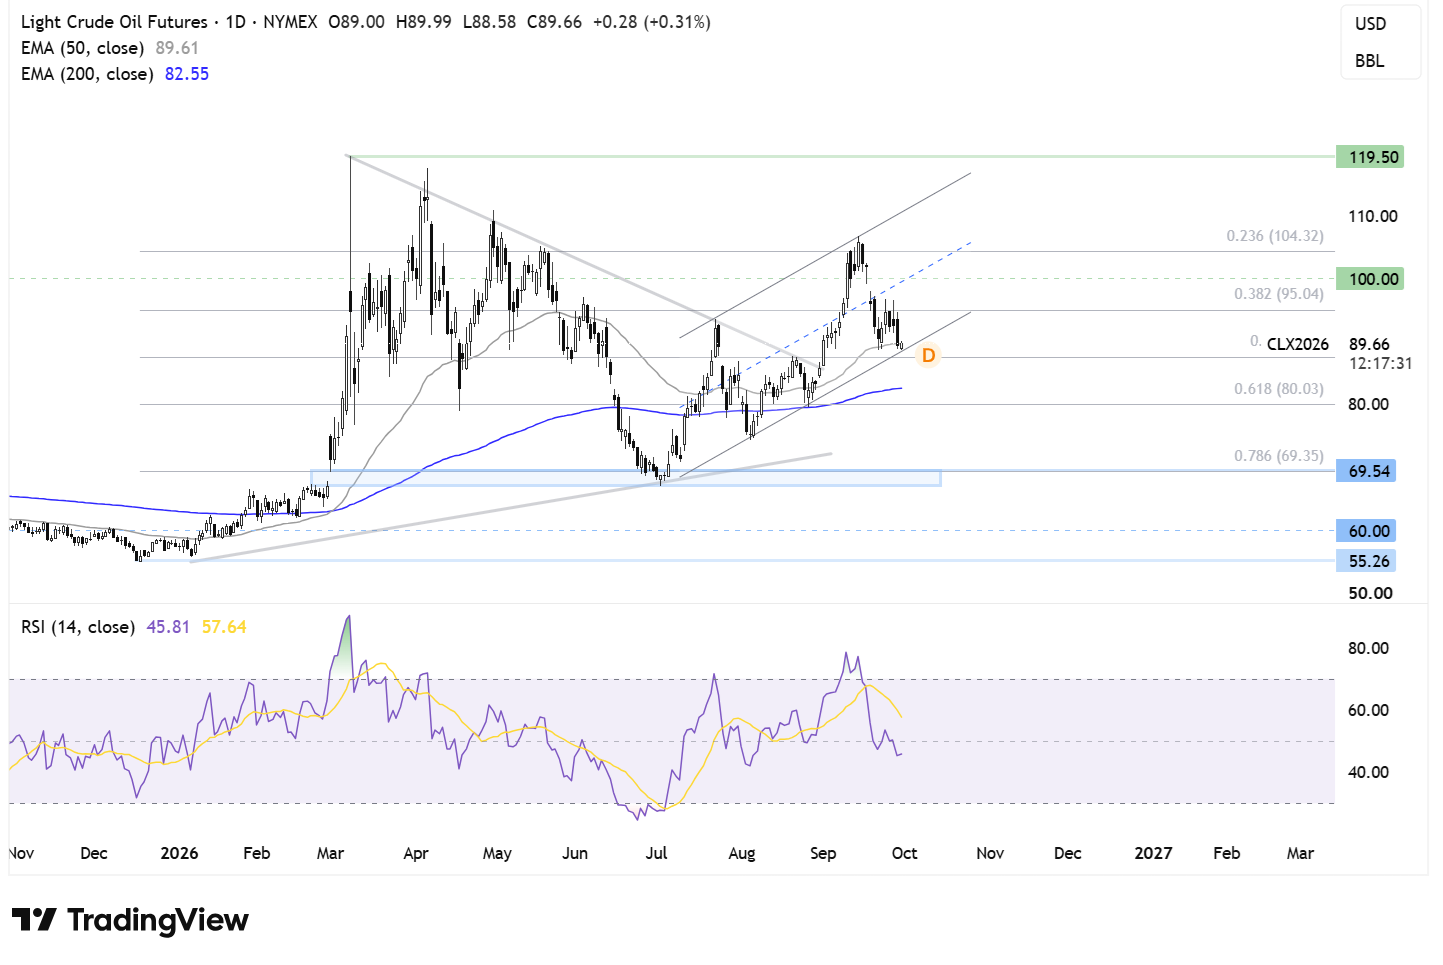
Oil trades in an ascending channel dating back to early July. The price recently ran into resistance at $106.75 before rebounding lower and is currently testing the lower band of the rising channel and the 50 EMA around $89. The RSI is below 50.
Should sellers break below the $89 support zone and the 38.2% Fibonacci retracement of the $55 low to $120 high, sellers could gain traction towards the 200 EMA at $82.50 and the 61.8% Fibonacci retracement at $80. Below here, attention will turn towards $75, the August low.
Should the $89 level hold, buyers will need to rise above $95. The 38.2% Fibonacci retracement above here would bring $100, the psychological level, into focus, followed by $105, the 23.6% Fibonacci retracement.
Related tags:
Latest market news










Web Trader platform
Our sophisticated web-based platform is packed with features.
Open an account today
Experience award-winning platforms with fast and secure execution.
Economic calendar
Related articles

Nasdaq 100 Forecast: NDX slips ahead of Fed Chair Warsh’s speech
U.S. stocks are edging lower on Friday, giving back some of yesterday's gains after Nvidia's strong outlook revived the tech trade. The focus has now shifted firmly to Fed Chair Kevin Warsh's Jackson Hole speech, with investors looking for more clarity on the outlook for interest rates.

S&P 500 Forecast: SPX after Nvidia revives confidence in the AI trade
U.S. stocks are heading higher on Thursday, with technology leading the move after Nvidia's stronger-than-expected outlook revived confidence in the AI trade.

DAX, GBP/USD Forecast: Two trades to watch 2708
DAX rises as Nvidia boosts AI trade ahead of Jackson Hole. GBP/USD slips below 1.36 as Fed expectations shift.