


Bitcoin Analysis: Is Uncertainty Returning to BTC?
Recent trading sessions have not been particularly supportive of a clear directional move in Bitcoin. This can be seen in the behavior of the price over the last four sessions, where fluctuations have remained close to 1.00% without establishing a consistent trend. As a result, a growing sense of neutrality is beginning to emerge around BTC.
Written by
Julian Pineda
Market Analyst
Recent trading sessions have not been particularly supportive of a clear directional move in Bitcoin. This can be seen in the behavior of the price over the last four sessions, where fluctuations have remained close to 1.00% without establishing a consistent trend. As a result, a growing sense of neutrality is beginning to emerge around BTC.
For now, Bitcoin's ability to regain momentum appears to be limited by the strength of alternative markets such as the U.S. dollar. This dynamic may be reducing Bitcoin's relative appeal as a risk asset and making it more difficult for demand to return at the same pace seen weeks ago. As long as the dollar remains well supported, BTC may continue to struggle to regain momentum, keeping the current phase of indecision relevant in the near term.
Is Demand Starting to Lose Momentum?
As the week progresses, one of the most influential themes across financial markets remains the expectation of a more aggressive Federal Reserve over the coming months. This remains relevant ahead of the release of the U.S. Core PCE report, an inflation measure closely monitored by the Fed when assessing monetary policy decisions.
For now, expectations continue to point toward a restrictive central bank stance. In fact, probabilities for the October meeting still show more than a 50% chance of another interest rate increase, according to estimates from CME Group.
What makes this particularly important is the impact it has had on the U.S. bond market. Yields on 10-year Treasury bonds have already climbed toward the 5.3% area, levels not seen in decades. This matters because bonds can become an attractive alternative to Bitcoin for a portion of investors, especially in an environment where the dollar continues to benefit from higher yields and its status as a safe-haven asset.
This relationship can be seen in the recent behavior of both markets. While the DXY, which measures the strength of the U.S. dollar against its major rivals, continues to trade above the 101-point mark, Bitcoin has shown a much more cautious performance over the same period. In addition, the correlation coefficient between the two assets over the last 100 sessions remains around -0.44, reflecting a moderate negative relationship between the two markets. It is important to remember that this correlation can change over time.
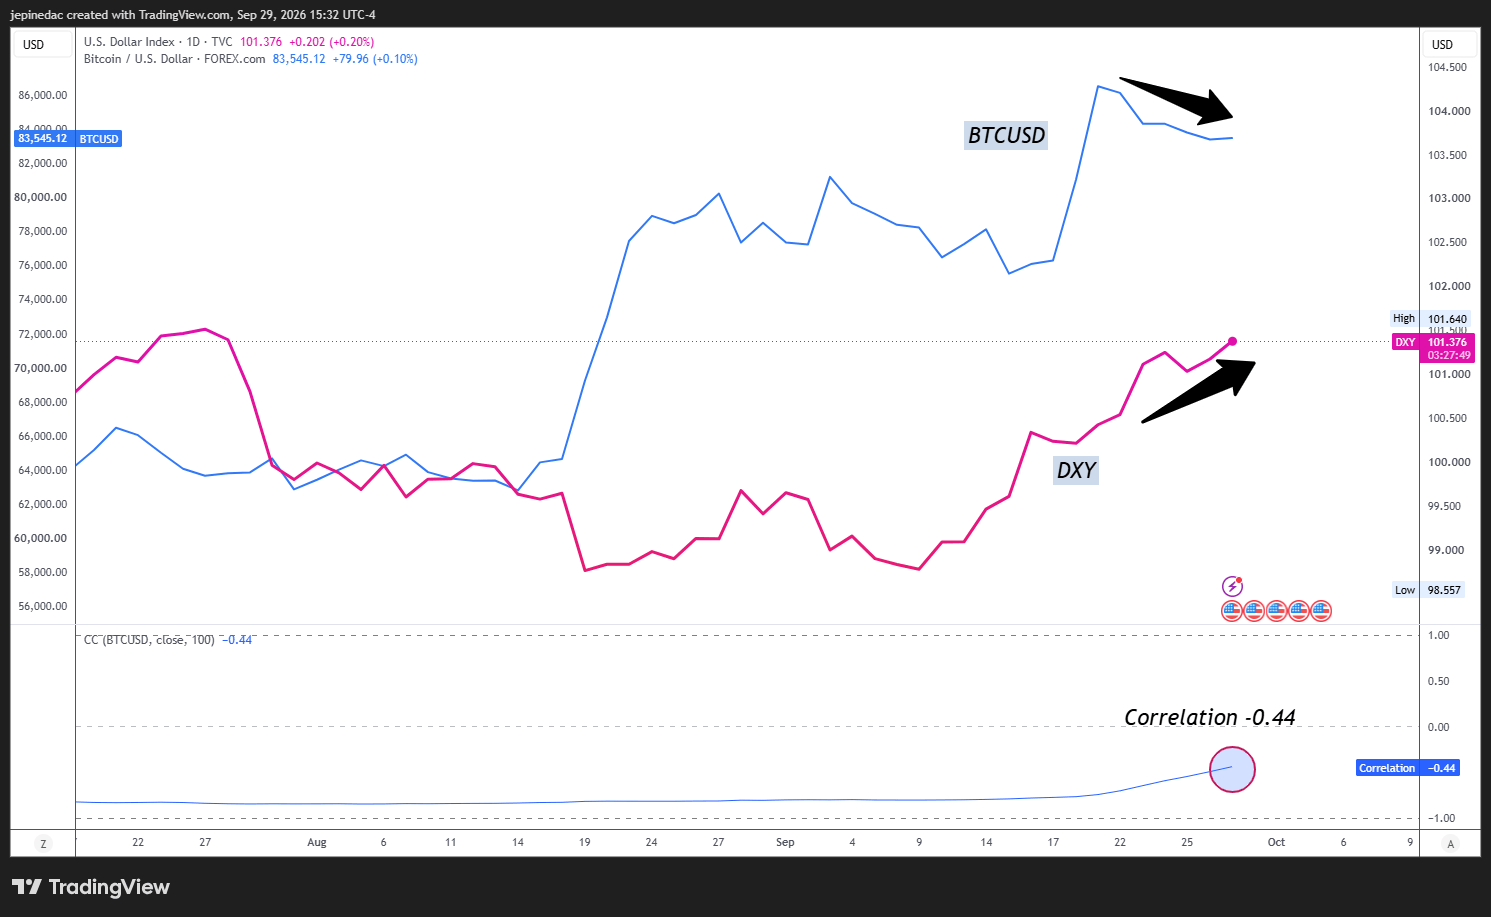
Source: StoneX,TVC, Tradingview
This relationship remains important because a higher-rate environment not only tends to reduce appetite for risk assets such as Bitcoin, but also increases the attractiveness of dollar-denominated assets. As demand for the dollar continues to grow, part of the capital that could otherwise move into the cryptocurrency market may find more attractive opportunities elsewhere. Under this scenario, BTC's recovery could continue to face limitations in the short term.
It is also worth monitoring recent activity across the Bitcoin network. On September 28, confirmed transactions reached approximately 780,000, showing a meaningful increase compared with the previous week. However, what stands out is that this rise in network activity has not been accompanied by a similar advance in price. This divergence may suggest that participation within the market is increasing, but without sufficient net buying pressure to drive prices meaningfully higher. To some extent, this could reflect portfolio rotation or a more cautious attitude among market participants.
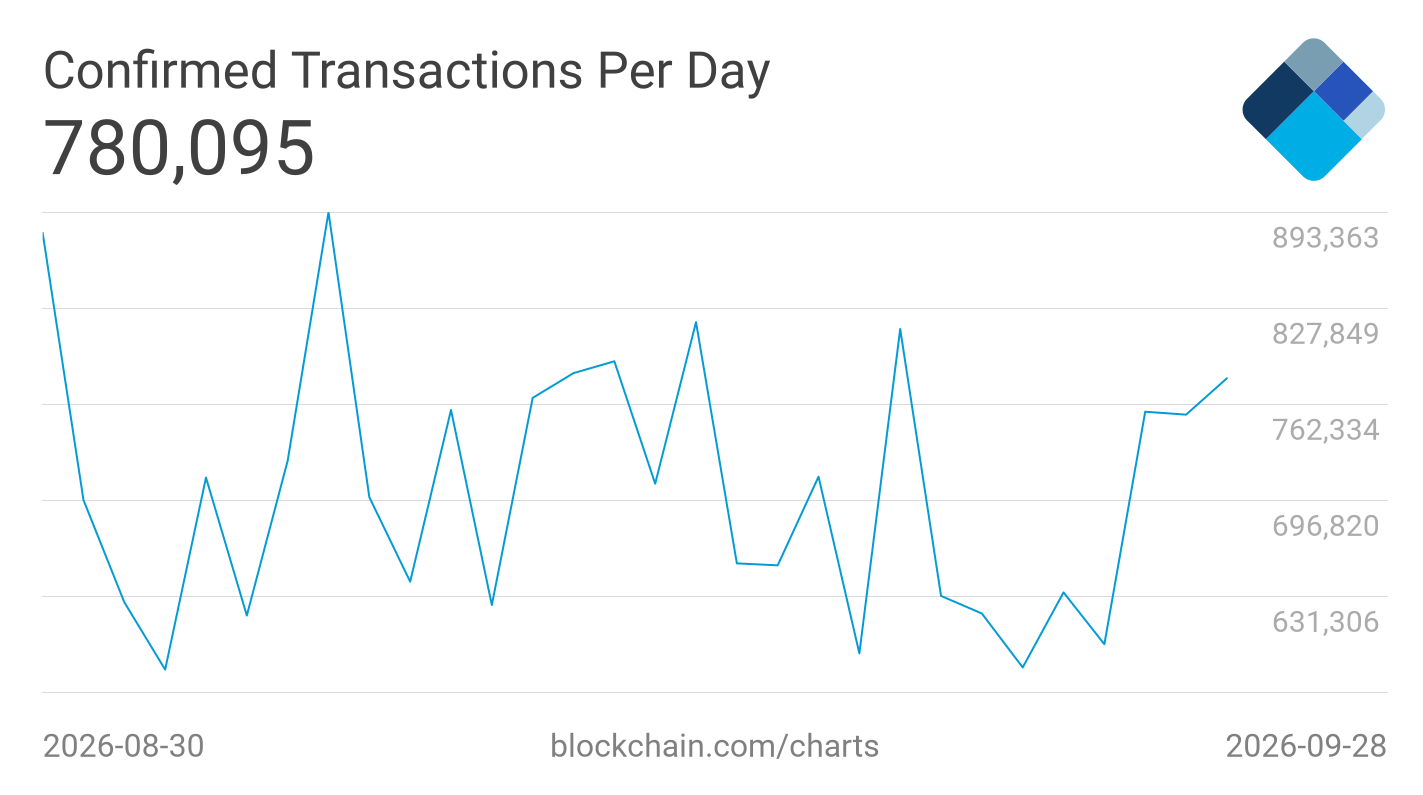
Source: blockchain.com
Taking all of this into account, the current backdrop of a more aggressive Federal Reserve continues to support demand for the U.S. dollar while limiting Bitcoin's ability to regain momentum. The buying pressure that dominated several weeks ago has yet to re-establish itself as the main force behind price action. As long as alternative markets continue to show stronger relative performance, BTC's upside may remain limited and the current phase of indecision could continue to be a key feature of the market in the sessions ahead.
Bitcoin Technical Forecast
Source: StoneX, Tradingview
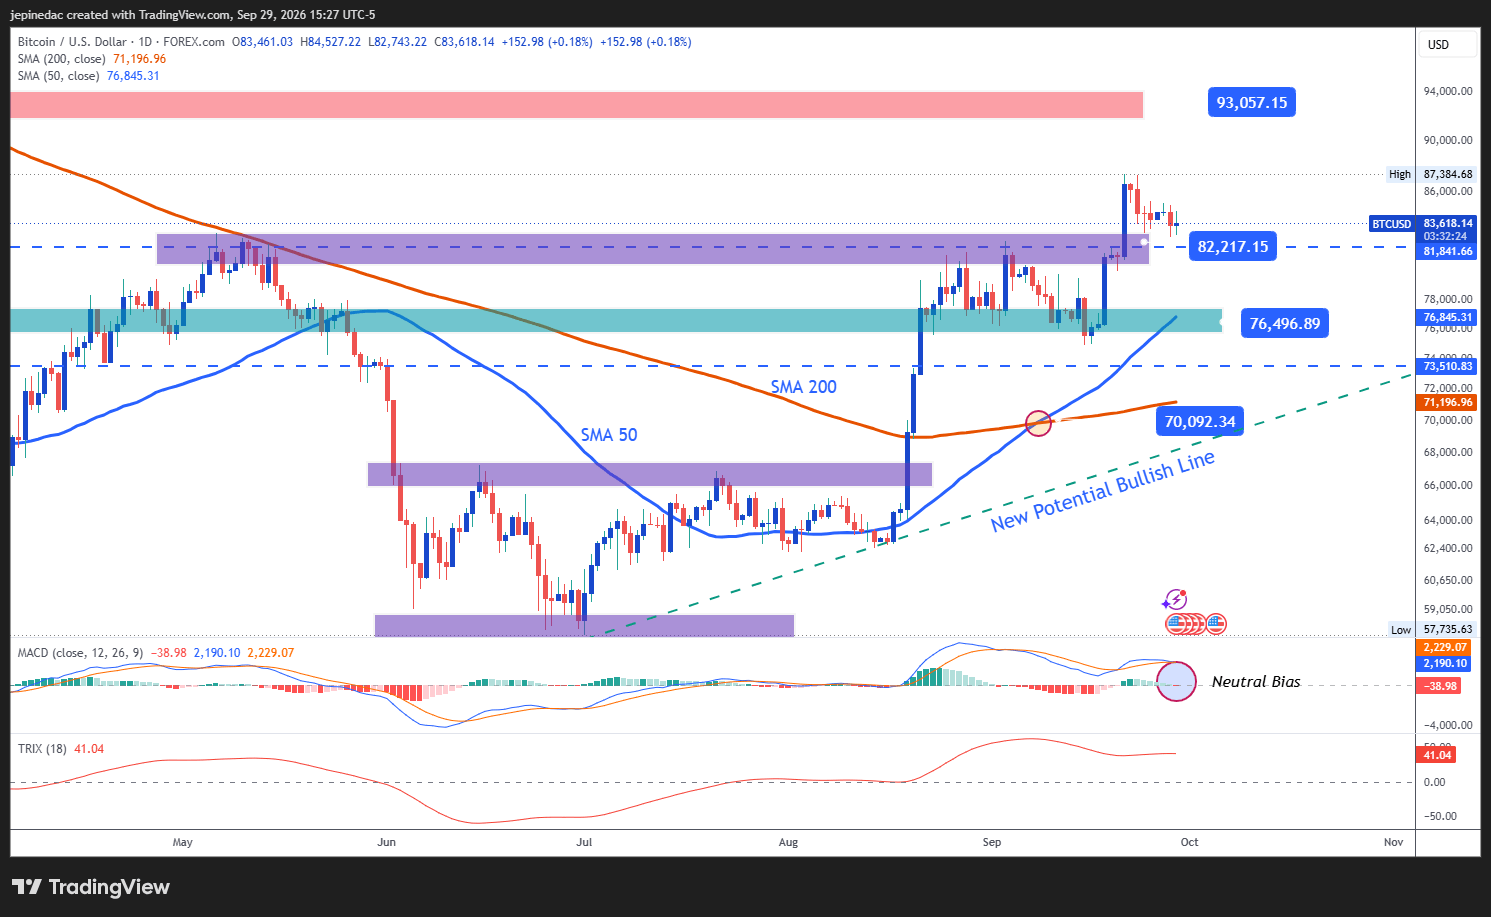
- The uptrend enters a consolidation phase: Over recent months, BTC has maintained a consistent sequence of higher highs and higher lows, helping establish a meaningful bullish trendline on the daily chart. This remains the dominant technical structure for the market. However, the recent lack of direction is beginning to reflect a loss of buying momentum. If stronger directional pressure fails to return over the coming sessions, a broader consolidation phase could begin to develop and potentially give way to a more evident trading range.
- MACD: The MACD histogram continues to develop around the 0 neutral line, reflecting an increasingly balanced dynamic within short-term moving averages. This reading supports the idea that a period of indecision is becoming more visible across Bitcoin price action.
- TRIX: The TRIX indicator presents a similar picture. Its relatively flat behavior suggests that bullish momentum within exponential moving averages has slowed considerably, reinforcing the possibility of a more prolonged period of neutrality in the short term.
Key Levels:
- $93,000 – Key Resistance: A major high first seen in December 2025 that continues to represent the most important upside barrier on the chart. The level also stands above the significant $90,000 psychological threshold. Price action that consistently approaches this area could reinforce the dominant bullish bias and encourage a further acceleration of the broader uptrend.
- $82,000 – Near-Term Barrier: A level that coincides with an important zone of equilibrium and retracements observed during recent weeks. Continued price action around this area could reinforce the current period of indecision and potentially encourage the development of a short-term trading range.
- $76,500 – Critical Support: A key support area that coincides with the 50-period simple moving average. Sustained moves below this level could support a more dominant bearish bias and begin to threaten the current bullish trendline as the primary structure on the chart.
Written by Julian Pineda, CFA, CMT – Market Analyst
Follow him on: @julianpineda25
Related tags:
Latest market news










Web Trader platform
Our sophisticated web-based platform is packed with features.
Open an account today
Experience award-winning platforms with fast and secure execution.
Economic calendar
Related articles

Bitcoin Forecast: BTC/USD Back to $80K Ahead of Warsh’s Jackson Hole Speech
After surging over $15,000 in the past 10 days alone, there is risk of a near-term pullback if Warsh says anything remotely hawkish at Jackson Hole - what are the levels to watch from here?


Bitcoin, Gold Price Outlook: US CPI & Overbought Risks in Focus
Bitcoin, Gold Price Outlook Following a steep risk-on rally across US equity indices and precious metals, several major markets are approaching critical technical levels as momentum becomes increasingly stretched.


Bitcoin, Dow Jones Outlook: Dow Tests Major Resistance and Bitcoin Lags Below $67,000
Bitcoin, Dow Jones Outlook: Bitcoin remains below $67,000 while the Dow Jones tests major multi-year resistance. Key technical levels that could determine the next market move.