


Euro Forecast: EUR/USD Tumbles Towards Yearly Low as Daily RSI Goes Oversold
EUR/USD has been hit hard in the final month of the quarter as USD strength has shown up in a big way. With the pair set to challenge its yearly low as RSI has pushed into oversold territory, is there a chance for a pullback with some big headline risk hitting in the US over the next few days?
Written by
James Stanley
Sr. Strategist
EUR/USD, Euro Talking Points:
- It’s been a one-way move for EUR/USD since a week before the Fed’s rate hike, as the pair has dropped by more than 300 pips and is now nearing a re-test of the yearly low that was set back in June.
- Longer-term, the pair has been showing tendency of mean reversion for the past 15 months and during that time, overbought and oversold reads via daily RSI have highlighted inflection points for several swings. The indicator just went into oversold territory for the first time since that June low.
The proverbial rubber band is pulled back across several USD pairs as DXY has continued a strong rally over the past three weeks. The Fed rate decision has certainly played a role, although that rate hike was largely expected even before then. But perhaps the tone from the Fed towards another hike is what caught markets by surprise and to be sure, there’s now a building probability for two more hikes as we go into the end of the year.
From that perspective, it’s also the run in Treasury yields that’s contributing to a degree, as a Fed that’s not perceived as serious in their inflation fight gives investors even fewer reasons to hold duration. After all, would you want to hold debt for 10 years at a 5% rate if inflation was expected to maintain at 3.5% or more? And what if the Fed was cavalier in shrugging that off, instead, looking to cut rates to stimulate business investment. Well, there would be even less reason to want to hold that debt.
This is often a misunderstood and mis-diagnosed relationship across markets as particpants will often want to tie one thing to the other, positing that weakness in bonds should mean weakness in the currency but one look at a correlation coefficient shows that the relationship is far less consistent than that. It’s situational, such as we have now, and it’s also one of comparison when we’re talking about currencies because the asset class is so unique.
The only way to value a currency – is with another currency – and in a pair like EUR/USD that relationship is quite clear. But, for the past 15 months, by and large, that relationship has been fairly consistent, even with the constant pushing from the Trump administration in trying to coax a weaker Dollar.
EUR/USD Weekly Chart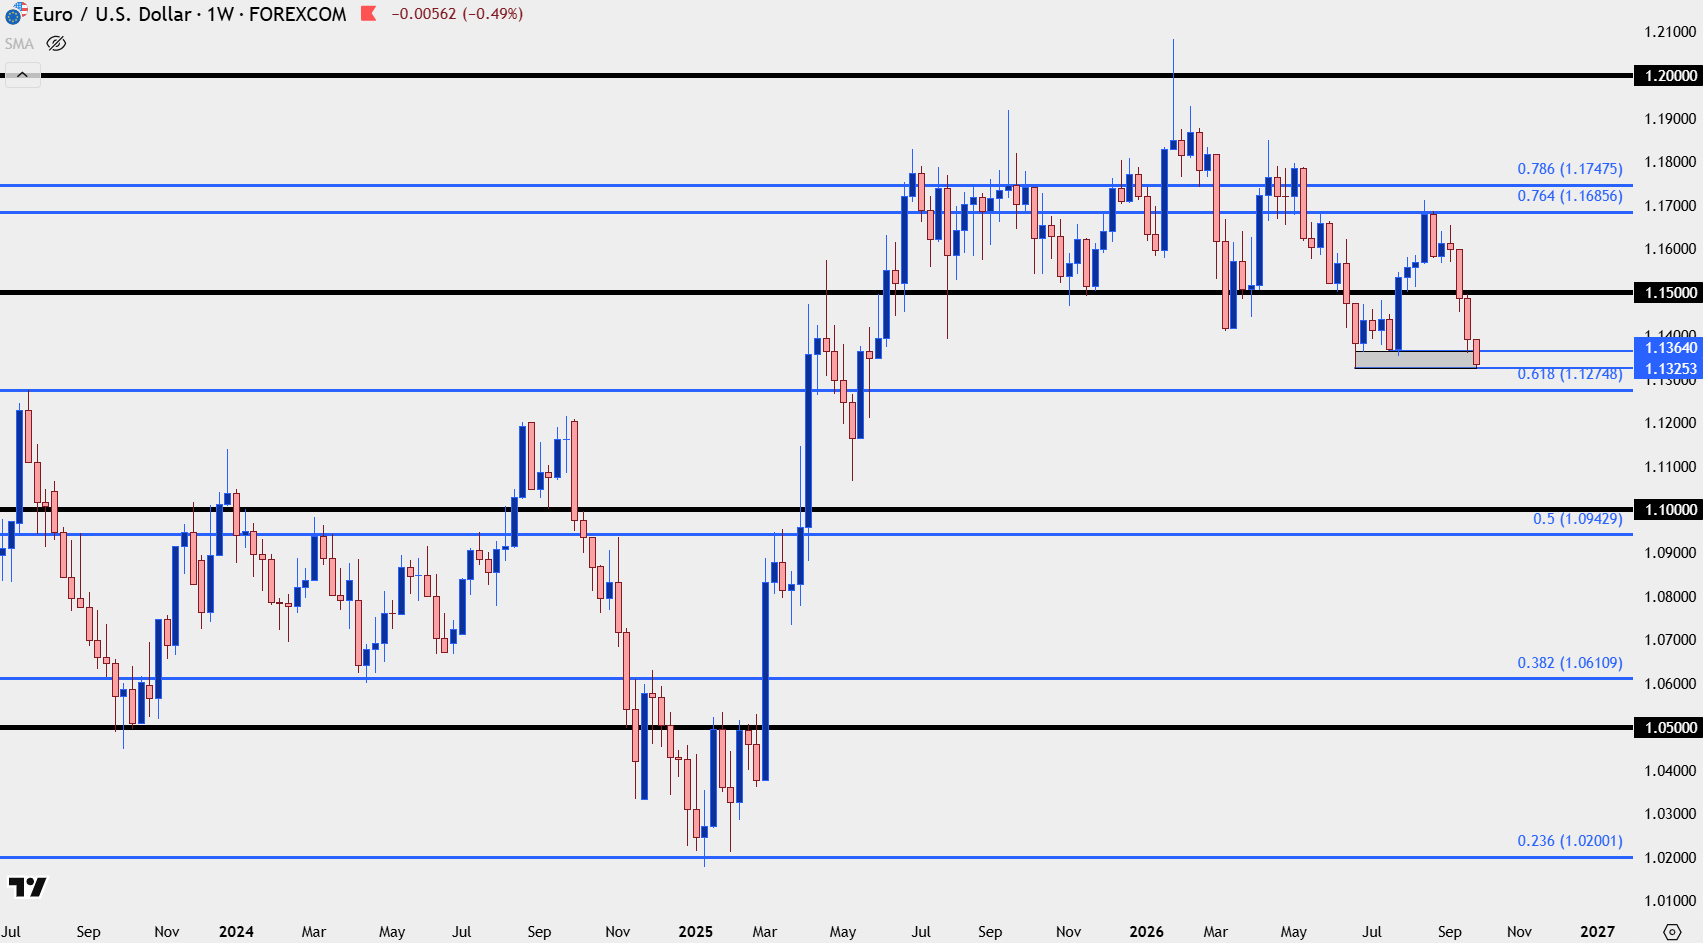
Chart prepared by James Stanley; data derived from Tradingview
EUR/USD Oversold
At this point, the RSI indicator is at its most oversold since March on the daily chart. And I’m not a big ‘RSI as a timing indicator’ type of person, as it’s simply a lagging indicator and the past is not predictive of the future. But – it does provide important context, and it helps to point out market extremes. Since the mean-reversion in EUR/USD began around the second half of last year, there’s been a handful of overbought or oversold moves via RSI, and most have shown near inflections of local highs or lows that preceded a swing in the other direction.
This does not mean that each RSI 30 or 70 cross will pan out the same and I’ve added two in dashed red vertical lines towards the left of the chart that shows when this did not happen. But – if a trader is looking at fading this recent run of USD-strength, or if the trader anticipates this mean-reverting backdrop to continue, this can be valuable information that can serve as the initial inkling for a trade idea.
At this point, the RSI indicator would need to cross back above 30 to bring this to fruition so that would mean a day or two of relative strength.
EUR/USD Daily Price Chart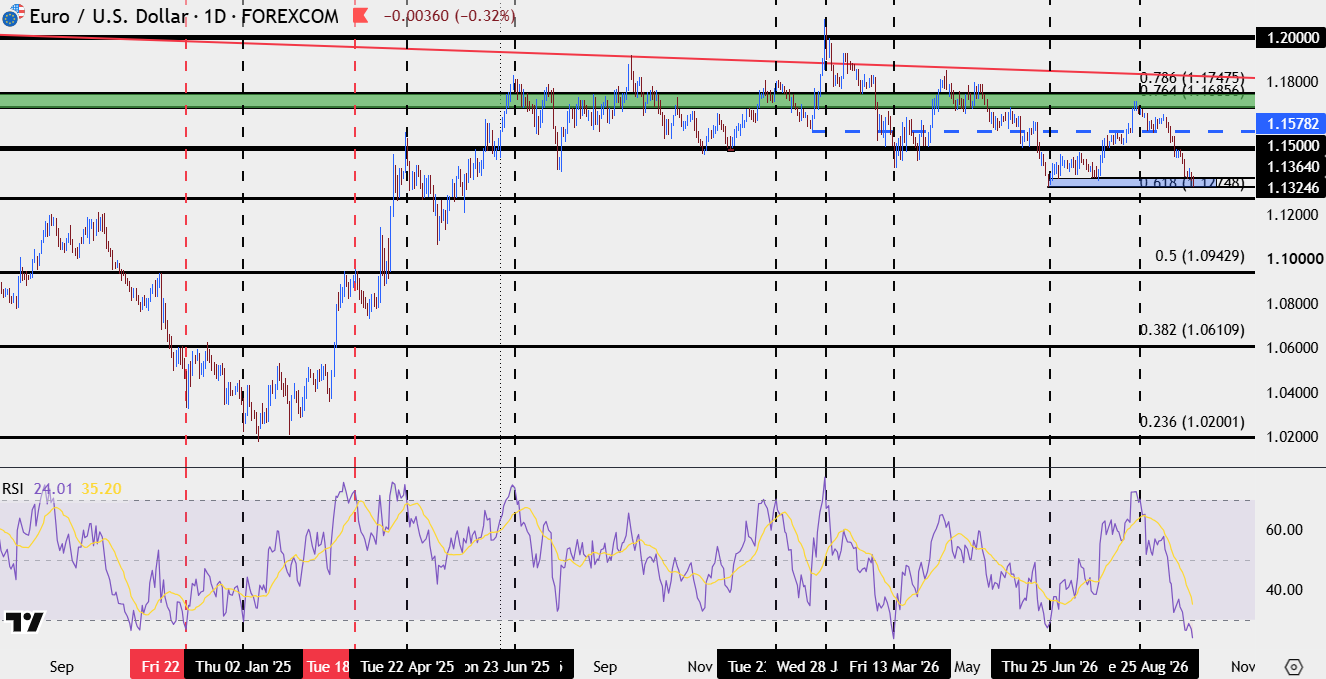
Chart prepared by James Stanley; data derived from Tradingview
EUR/USD Falling Knives
At this point EUR/USD is in a fast descent towards the yearly low, which was set back in June at 1.1325. Notably, there was a higher-low set in July at 1.1364, and that had provided a bounce last week that, so far, has been faded. Longs at this point would be akin to trying to catch a falling knife.
What could possibly present a setup on shorter-terms is a probe of a fresh low, followed by failure from sellers to follow-through. An exposed underside wick could illustrate that possibility and as we go into some heavy event risk later this week, with Core PCE and NFP dominating the calendar, this could present a compelling backdrop to start looking for mean reversion, particularly if that pairs with a crossover on daily RSI of the 30-level.
EUR/USD Four-Hour Chart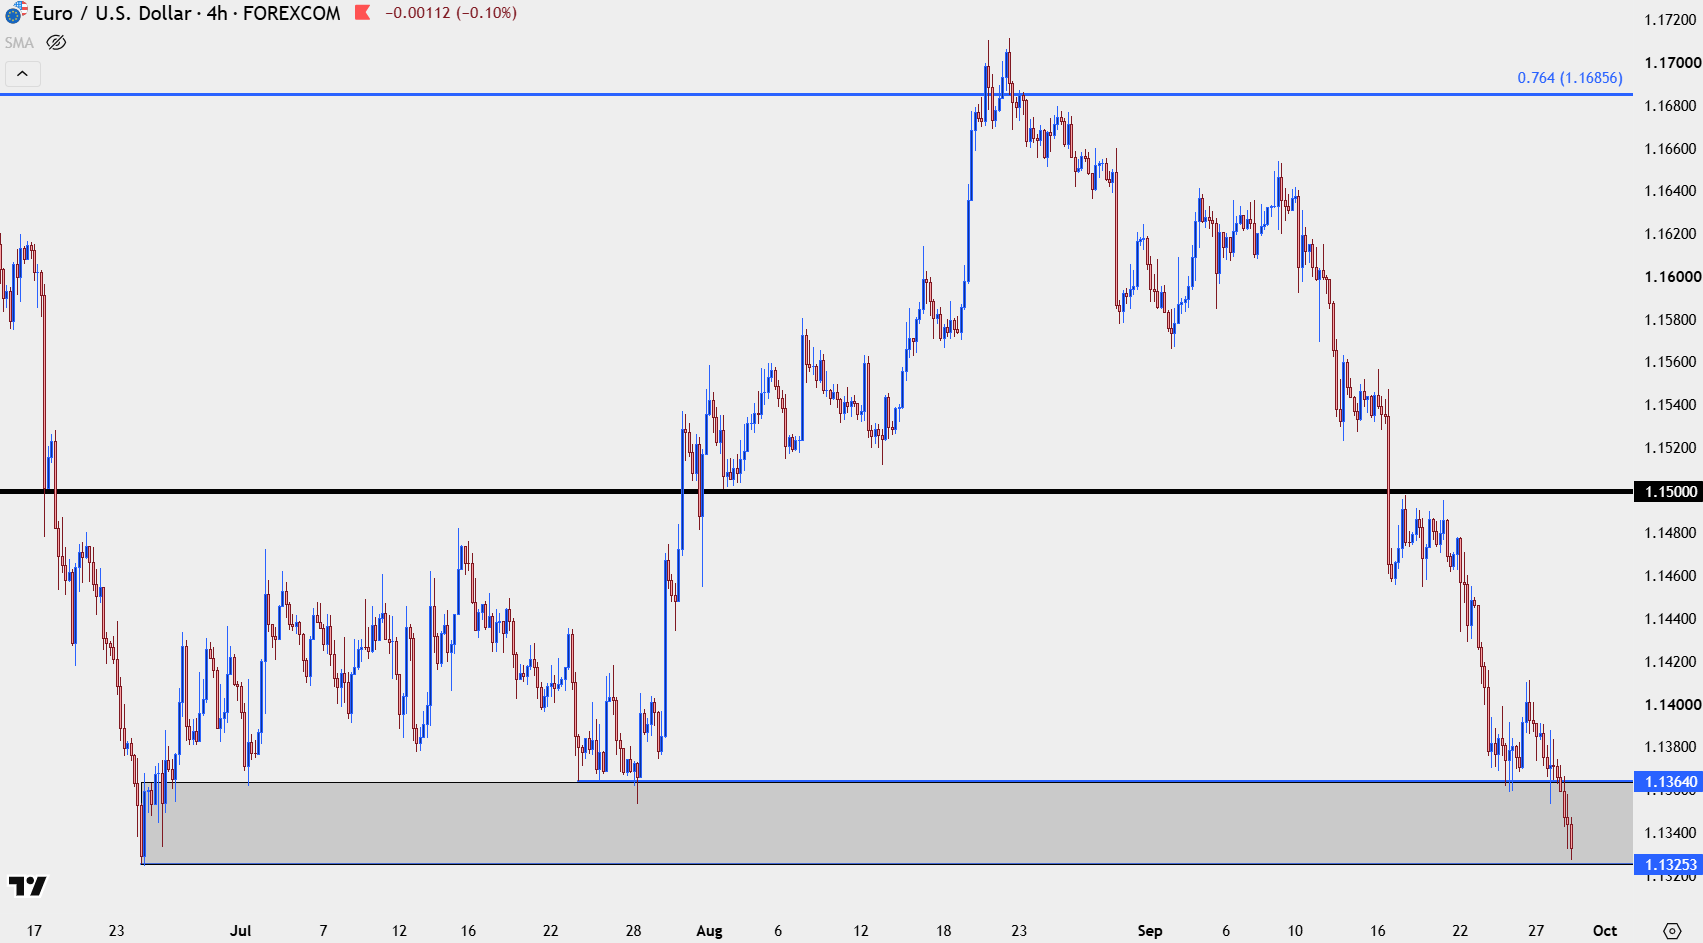
Chart prepared by James Stanley; data derived from Tradingview
--- written by James Stanley, Senior Market Analyst, Global Macro
Related tags:
Latest market news










Web Trader platform
Our sophisticated web-based platform is packed with features.
Open an account today
Experience award-winning platforms with fast and secure execution.
Economic calendar
Related articles

EUR/USD forecast: All eyes on Warsh at Jackson Hole - Forex Friday
For much of this week, the EUR/USD has been edging lower with the US dollar regaining some ground after last week’s sell-off that was triggered, in part, by the bond market worries. Investors have been unwilling to bet further against the US dollar so far this week ahead of Kevin Warsh’s keynote speech at the Jackson Hole summit, due later today.


DAX and EUR/USD forecast: Lower energy prices, yields offer support
But the question, of course, is how much further oil prices and bond yields can fall. For now, the combination is supportive of risk assets and is helping to sustain a relatively benign decline in the dollar. The focus today will be on US core PCE inflation, due for release shortly, while Nvidia’s second-quarter earnings will provide another test for risk appetite after the US markets close – not just for US indices but for global tech-heavy indices given the influence Nvidia has over the global tech and AI names.

Oil, EUR/USD Forecast: Two trades to watch 2608
Oil falls further on diplomatic hopes for a Middle East resolution. EUR/USD consolidates ahead of U.S. inflation and Jackson Hole.