



GBP/USD Approaches November 2023 Low
GBP/USD approaches the November 2023 low (1.2096) after failing to defend the 2024 low (1.2300).
Written by
David Song
Strategist
US Dollar Outlook: GBP/USD
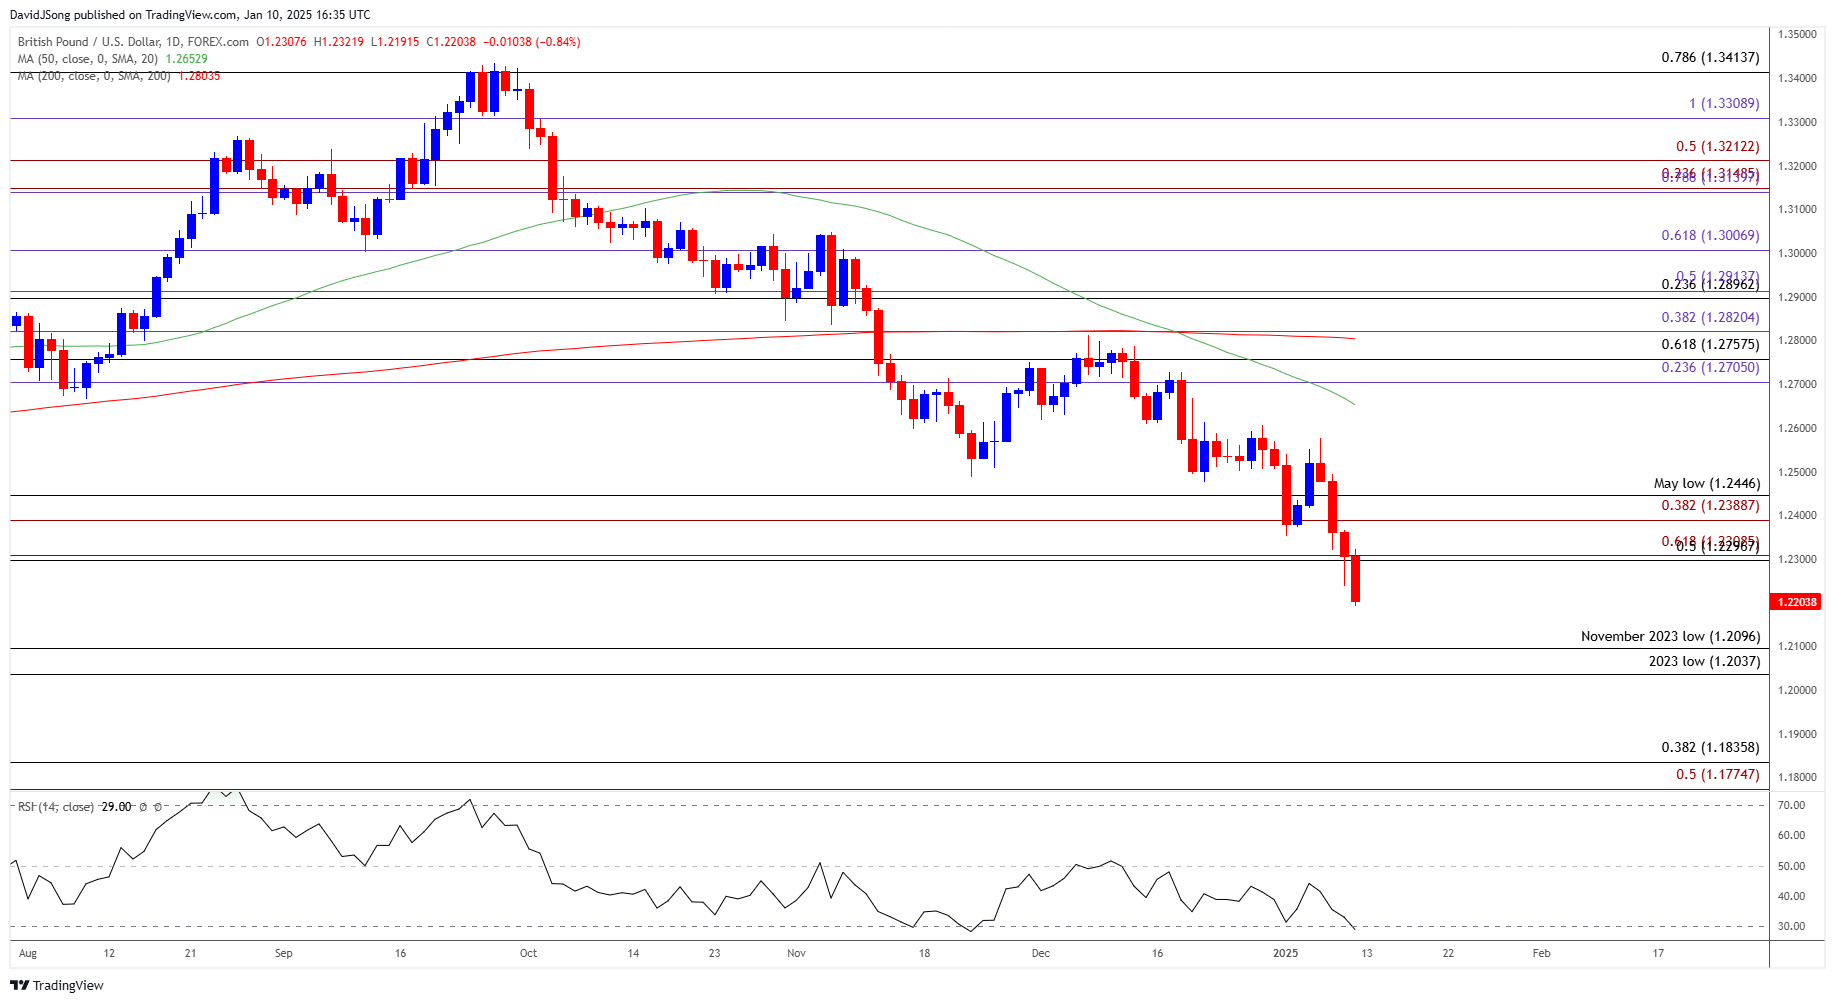
GBP/USD approaches the November 2023 low (1.2096) after failing to defend the 2024 low (1.2300), with the recent decline in the exchange rate pushing the Relative Strength Index (RSI) up against oversold territory.
GBP/USD Approaches November 2023 Low
GBP/USD falls to a fresh weekly low (1.2192) as the US Non-Farm Payrolls (NFP) report shows a 256K rise in December versus forecasts for a 160K print, and a move below 30 in the RSI is likely to be accompanied by a further decline in the exchange rate like the price action from last year.
Join David Song for the Weekly Fundamental Market Outlook webinar.
In turn, GBP/USD may continue to track the negative slope in the 50-Day SMA (1.2654) as it carves a series of lower highs and lows, and it remains to be seen if the Federal Reserve will respond to the better-than-expected NFP report as Federal Reserve Governor Michelle Bowman revealed that ‘I could have supported taking no action at the December meeting’ while speaking at the California Bankers Association.
Governor Bowman went onto say that ‘the current stance of policy may not be as restrictive as others may see it’ amid the ongoing strength in the US economy, and little signs of a recession may lead to a dissent within the Federal Open Market Committee (FOMC) amid the ‘lack of further progress on slowing inflation.’
With that said, the weakness in GBP/USD may persist as Fed officials adopt a less dovish outlook for monetary policy, but the RSI may show the bearish momentum abating should the oscillator hold above oversold territory.
GBP/USD Price Chart –Daily
Chart Prepared by David Song, Senior Strategist; GBP/USD on TradingView
- GBP/USD marks a four-day selloff for the first time since November, and failure to defend the November 2023 low (1.2096) may lead to a test of the 2023 low (1.2037).
- Next area of interest comes in around 1.1780 (50% Fibonacci extension) to 1.1840 (38.2% Fibonacci retracement), but lack of momentum to test the November 2023 low (1.2096) may curb the recent decline in GBP/USD.
- Need a move back above the 1.2300 (50% Fibonacci retracement) to 1.2310 (61.8% Fibonacci extension) region for GBP/USD to clear the bearish price series, with a move back above the 1.2390 (38.2% Fibonacci extension) to 1.2446 (May low) zone bringing the monthly high (1.2576) on the radar.
Additional Market Outlooks
Gold Price Recovery Eyes December High
US Dollar Forecast: USD/CAD Stages Three-Day Rally
EUR/USD Weakness Brings January Opening Range in Focus
USD/JPY Clears December High Ahead of US NFP Report
--- Written by David Song, Senior Strategist
Follow on Twitter at @DavidJSong
Related tags:









Web Trader platform
Our sophisticated web-based platform is packed with features.
Open an account today
Experience award-winning platforms with fast and secure execution.
Economic calendar
Related articles

Euro Short-term Outlook: EUR/USD Pullback Nears Pivotal Uptrend Support 8 28 2026
Warsh's comments accelerated the EUR/USD selloff, raising the stakes as buyers look to stabilize the broader recovery.


Gold and S&P 500 analysis: What now after Warsh’s hawkish speech?
The dollar surged across the board after the Fed Chair Kevin Warsh surprised with a hawkish-leaning speech at the Jackson Hole summit. All the bearish dollar bets that had been accumulated since last Friday on the back of data weakness and bond market troubles had to be squared and that triggered a short squeeze rally for the dollar. Gold and silver dropped, as a result, as too did bitcoin, while US indices were giving back earlier gains.


EUR/USD forecast: All eyes on Warsh at Jackson Hole - Forex Friday
For much of this week, the EUR/USD has been edging lower with the US dollar regaining some ground after last week’s sell-off that was triggered, in part, by the bond market worries. Investors have been unwilling to bet further against the US dollar so far this week ahead of Kevin Warsh’s keynote speech at the Jackson Hole summit, due later today.