



Gold Price Outlook Mired by Flattening Slope in 50-Day SMA
The price of gold may give back the advance from the November low ($2537) as it struggles to trade back above the 50-Day SMA ($2668).
Written by
David Song
Strategist
Gold Price Outlook: XAU/USD
The price of gold appears to be stuck in a narrow range as it holds above the weekly low ($2622), but bullion may give back the advance from the November low ($2537) as it struggles to trade back above the 50-Day SMA ($2668).
Gold Price Outlook Mired by Flattening Slope in 50-Day SMA
The range-bound price action in gold may turn out to be temporary as it continues to hold below pre-US election prices, and the precious metal may no longer reflect the bullish trend from earlier this year amid the flattening slope in the moving average.
Join David Song for the Weekly Fundamental Market Outlook webinar.
US Economic Calendar
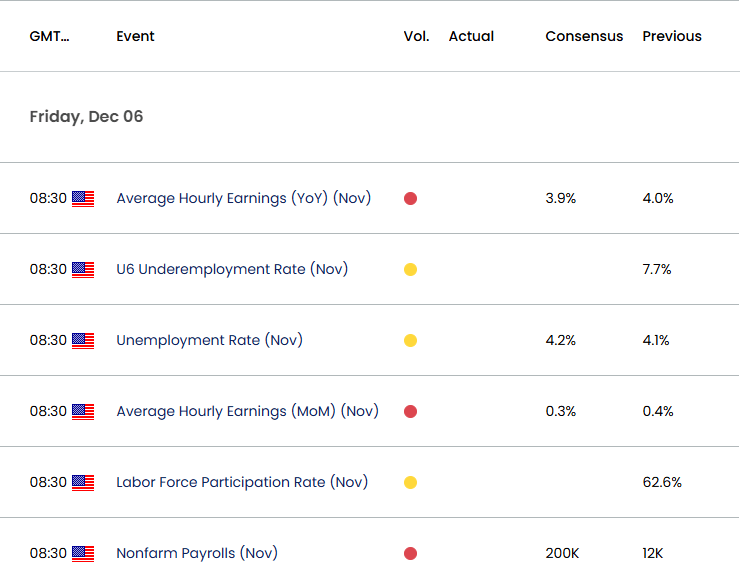
Nevertheless, data prints coming out of the US may sway gold prices as the Federal Reserve pursues a neutral stance, and the US Non-Farm Payrolls (NFP) report may push the central bank to the sidelines as the update is anticipated to show a 200K rise in November.
In turn, little signs of a looming recession may force the Federal Open Market Committee (FOMC) to keep interest rates on hold in December, and the threat of a policy error may prop up the price of gold as the precious metal offers an alternative to fiat-currencies.
With that said, the price of gold may consolidate over the coming days should if defend the weekly low ($2622), but bullion may struggle to retain the advance from the November low ($2537) amid the flattening slope in the 50-Day SMA ($2668).
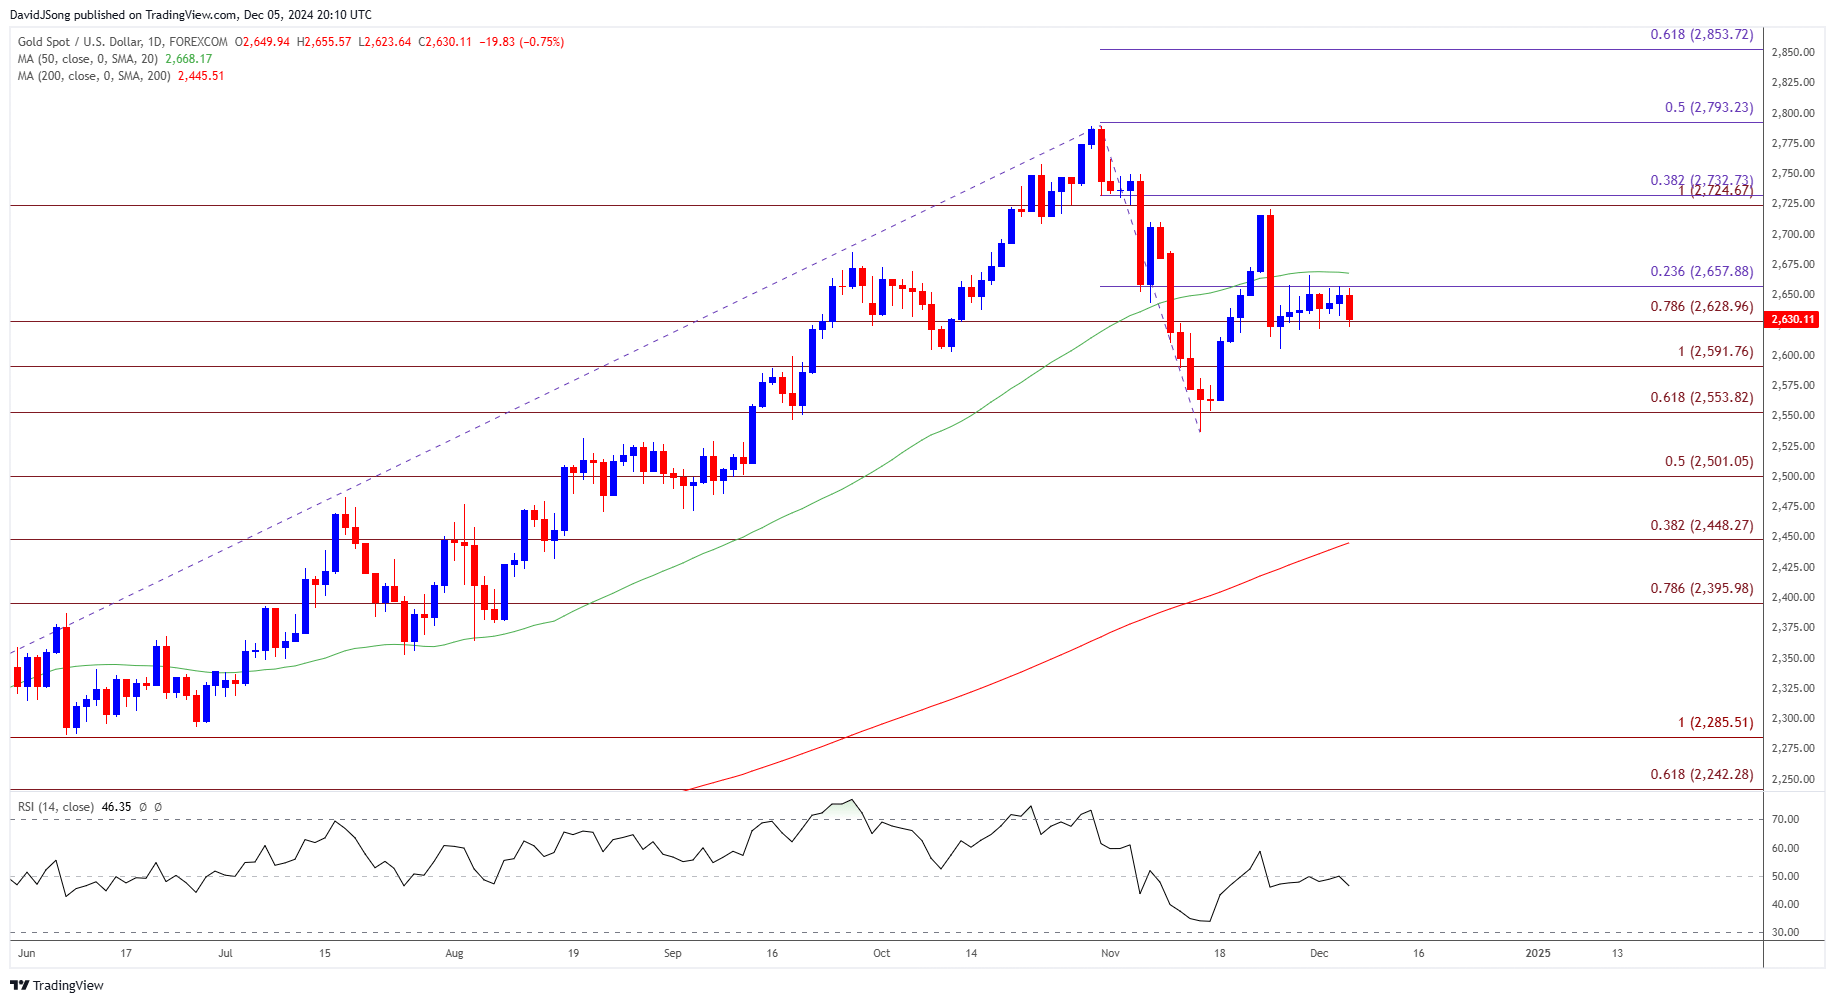
XAU/USD Price Chart – Daily
Chart Prepared by David Song, Strategist; XAU/USD on TradingView
- The price of gold may continue to track sideways as it holds within the range bound price action from earlier this week, but a close below the $2630 (78.6% Fibonacci extension) to $2660 (23.6% Fibonacci extension) region may push the precious metal back towards $2590 (100% Fibonacci extension).
- Next area of interest comes in around $2550 (61.8% Fibonacci extension), but a close above the $2630 (78.6% Fibonacci extension) to $2660 (23.6% Fibonacci extension) region brings $2730 (100% Fibonacci extension) back on the radar.
- A breach above the November high ($2762) raises the scope for a test of the October high ($2790), with a break/close above $2790 (50% Fibonacci extension) opening up $2850 (61.8% Fibonacci extension).
Additional Market Outlooks
EUR/USD Struggles to Trade Back Above Former Support Zone
GBP/USD Recovery Vulnerable as Bear Flag Formation Takes Shape
USD/CHF Pullback Faces Positive Slope in 50-Day SMA
USD/CAD Defends Post-US Election Rally to Eye November High
--- Written by David Song, Senior Strategist
Follow on X at @DavidJSong
Related tags:









Web Trader platform
Our sophisticated web-based platform is packed with features.
Open an account today
Experience award-winning platforms with fast and secure execution.
Economic calendar
Related articles

Euro Short-term Outlook: EUR/USD Pullback Nears Pivotal Uptrend Support 8 28 2026
Warsh's comments accelerated the EUR/USD selloff, raising the stakes as buyers look to stabilize the broader recovery.


Gold and S&P 500 analysis: What now after Warsh’s hawkish speech?
The dollar surged across the board after the Fed Chair Kevin Warsh surprised with a hawkish-leaning speech at the Jackson Hole summit. All the bearish dollar bets that had been accumulated since last Friday on the back of data weakness and bond market troubles had to be squared and that triggered a short squeeze rally for the dollar. Gold and silver dropped, as a result, as too did bitcoin, while US indices were giving back earlier gains.


EUR/USD forecast: All eyes on Warsh at Jackson Hole - Forex Friday
For much of this week, the EUR/USD has been edging lower with the US dollar regaining some ground after last week’s sell-off that was triggered, in part, by the bond market worries. Investors have been unwilling to bet further against the US dollar so far this week ahead of Kevin Warsh’s keynote speech at the Jackson Hole summit, due later today.