


Japanese Yen Outlook: USD/JPY Breaks Out in Style, GBP/JPY and CAD/JPY in Focus
USD/JPY breaks higher as Japanese yen weakness persists. See why GBP/JPY remains bullish and how crude oil could shape the next move in CAD/JPY.
Written by
Matt Simpson
Market Analyst
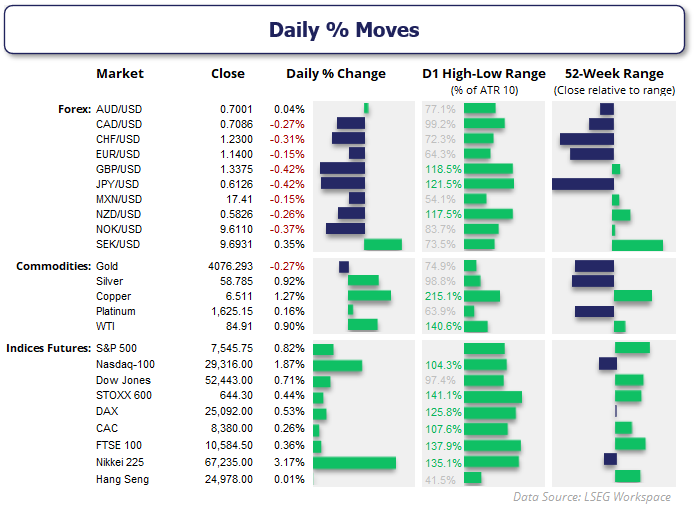
USD/JPY has finally broken higher after weeks of compression, with easing bearish sentiment towards the Japanese yen adding fuel to the rally. While the US dollar led the move, the technical backdrop also favours further upside for GBP/JPY, although crude oil prices remain a key variable for CAD/JPY bears.
Source: LSEG
View related analysis:
USD/JPY Leads as Japanese Yen Weakness Keeps GBP/JPY and CAD/JPY in Focus
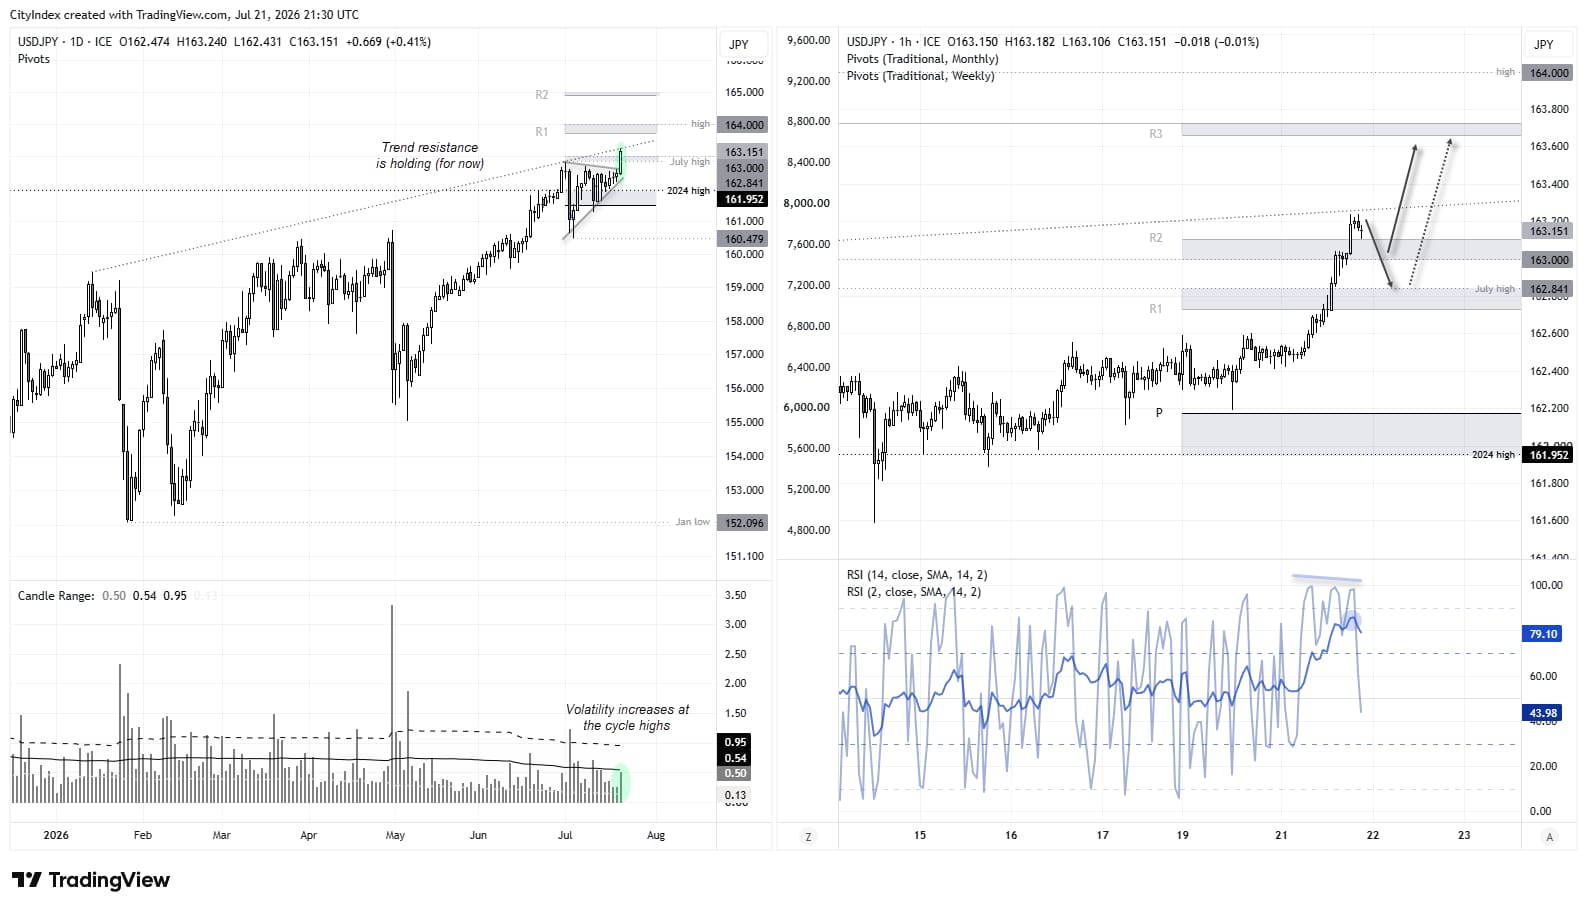
It only seemed a matter of time before volatility erupted on USD/JPY, given the compression pattern beneath its 39-year high. Momentum ultimately broke to the upside, helped by a strong session for the US dollar amid the latest flare-up in Middle East tensions.
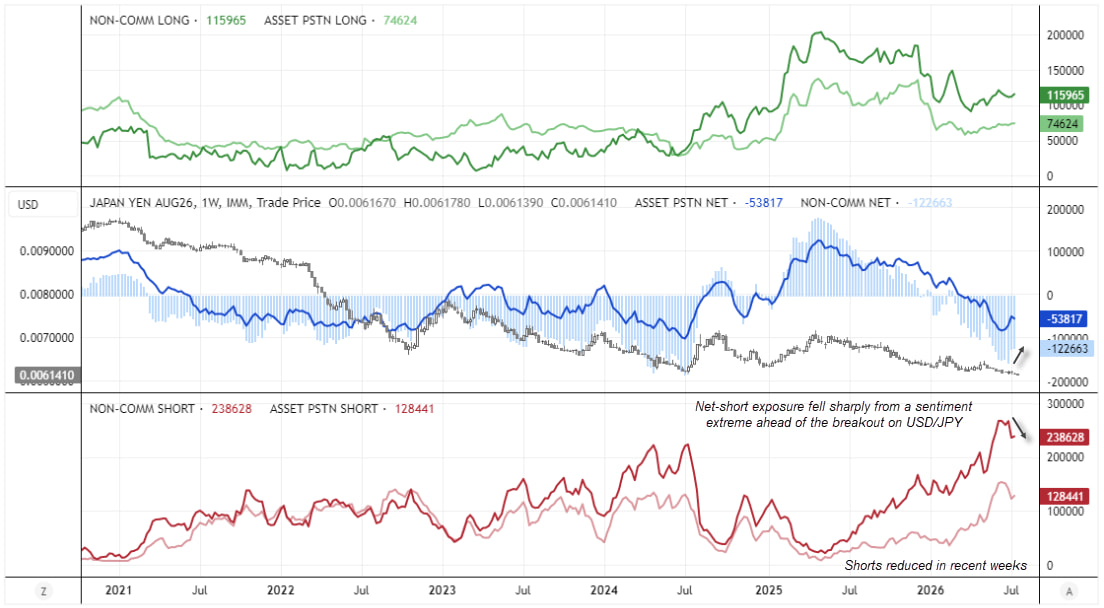
As noted in this week’s COT report, net-short exposure to the Japanese yen has moved away from a sentiment extreme. That removes some pressure from bearish yen positions and gives the USD/JPY breakout more breathing room. The question now is whether other currencies, such as the British pound or Canadian dollar could also take advantage of the weaker yen.
Source: CFTC (COT), LSEG
For traders wanting a deeper understanding of futures positioning, I’ve also published a guide on how to read and interpret weekly COT data in forex markets.

USD/JPY Tests Trendline Resistance After Breakout
Regular readers will know I am not an advocate of trendlines, but I concede they deserve attention from time to time. In this case, a trendline projected from the January high coincides with Tuesday's high, making it a valid interim resistance level. It is also one that could break, given the strength of the move out of the compression pattern.
The monthly R1 pivot (163.72) and 165.30 may be the next resistance levels for bulls if the trendline breaks. That said, prices appear stretched on the 1-hour chart, while bearish RSI divergences have formed in overbought territory, raising the potential for a near-term pullback. Bulls could look to buy dips within Tuesday's range, with 163 potentially providing support.
Source: ICE, TradingView
GBP/JPY Bulls Eye 219 as British Pound Holds the Advantage
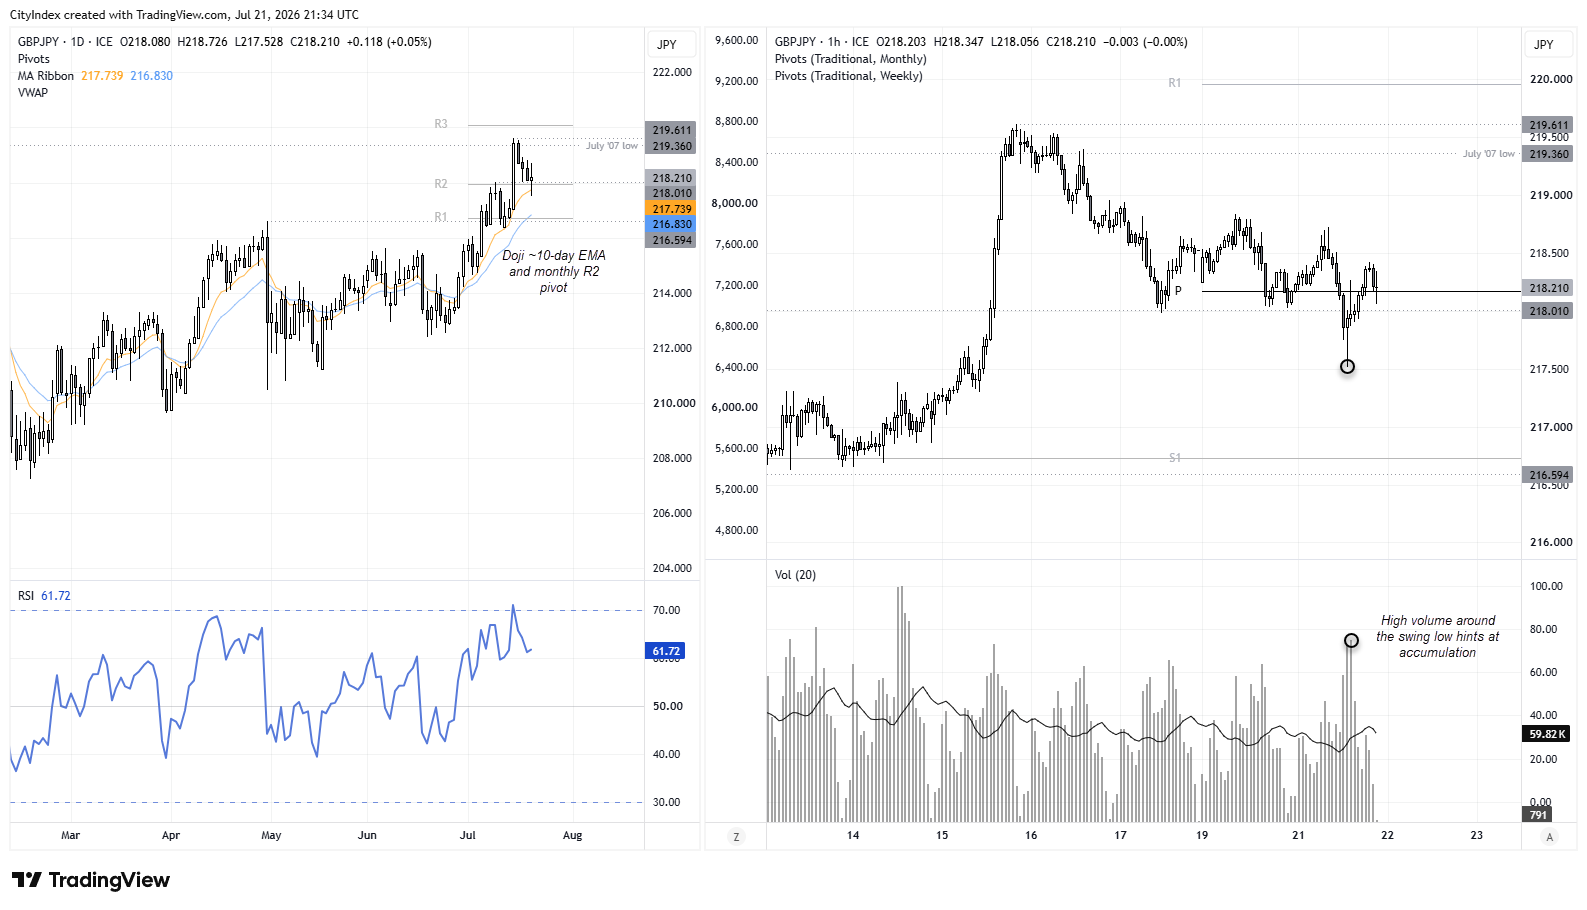
The GBP/JPY uptrend on the daily chart speaks for itself, with bullish momentum accelerating from the June low. Prices have retraced to the 10-day EMA and the monthly R2 pivot, while Tuesday's wide-legged doji has caught my eye as it hints at a swing low forming within a strong uptrend.
Price action on the 1-hour chart appears corrective, given the overlapping nature of the decline. Moreover, elevated volumes accompanied the swing low, reinforcing my suspicion of bullish accumulation above 217.50. GBP/JPY is now attempting to form a higher low around the 218.00 handle and the weekly pivot point.
Ultimately, my near-term bias for the British pound against the Japanese yen remains bullish while prices hold above Tuesday's low, with a move to 219.00 as the minimum upside target. Note the July 2007 low at 219.036 and the 219.61 high as additional resistance levels ahead of the weekly R1 pivot just below 220.00.
Source: ICE, TradingView
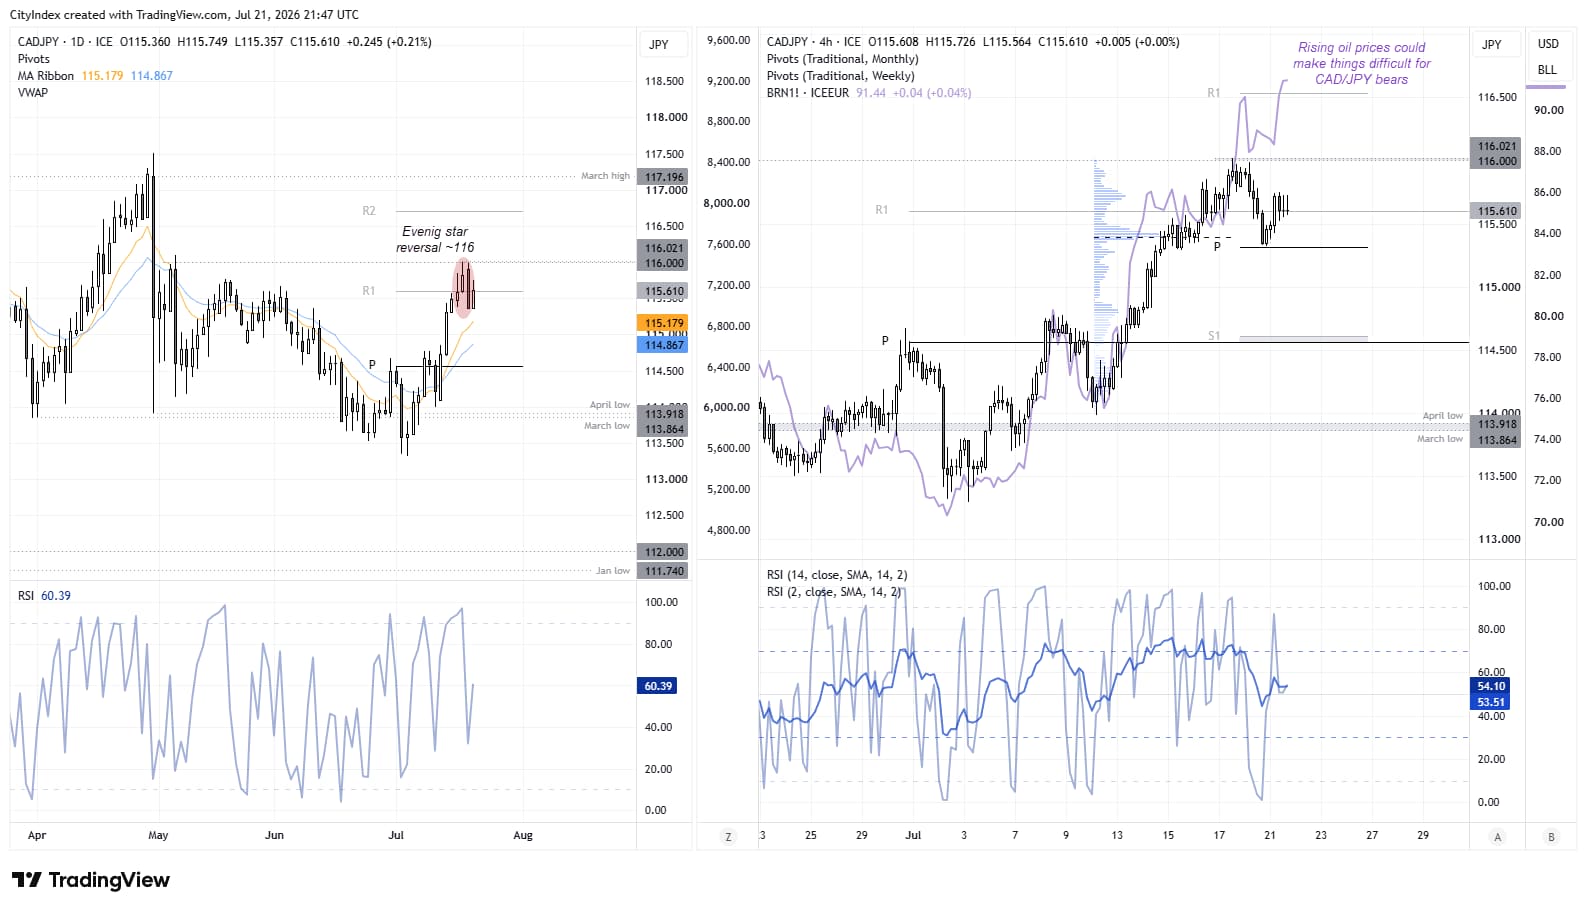
CAD/JPY Reversal Pattern Faces Crude Oil Headwind
The daily chart shows an evening star pattern (a three-bar bearish reversal) forming around the 116.00 handle, warning that a top may be in place. Tuesday's small bullish inside day represents a lacklustre attempt by bulls to reclaim lost ground, and the fact it closed around the monthly R1 pivot suggests CAD/JPY could be gearing up for another leg lower.
However, rising crude oil prices are a fly in the ointment for CAD/JPY bears. As a major oil exporter, Canada typically benefits from higher crude oil prices, which can underpin the Canadian dollar against the Japanese yen. If crude oil continues to rally, it could support CAD/JPY, or at least make life more difficult for bears. Conversely, if Middle East tensions ease and crude oil prices retreat, it could pave the way for the next leg lower in CAD/JPY.
A break below the weekly pivot point (115.31) would bring the weekly S1 level and monthly pivot point into focus near 114.50.

Source: ICE, TradingView
View the full economic calendar
-- Written by Matt Simpson
Follow Matt on Twitter @cLeverEdge
How to trade with City Index
You can trade with City Index by following these four easy steps:
- Open an account, or log in if you’re already a customer
• Open an account in the UK
• Open an account in Australia
• Open an account in Singapore
- Search for the market you want to trade in our award-winning platform
- Choose your position and size, and your stop and limit levels
- Place the trade
Related tags:







Web Trader platform
Our sophisticated web-based platform is packed with features.
Open an account today
Experience award-winning platforms with fast and secure execution.
Economic calendar
Related articles

Canadian Dollar Forecast: USD/CAD Weekly Reversal Puts Yearly Uptrend Back in Focus 8 29 2026
USD/CAD has staged its strongest weekly advance since June, shifting the focus to whether a more durable low is finally taking shape.


USD/JPY weekly outlook: Payrolls may challenge the Fed’s hawkish reset
USD/JPY has finally woken from its slumber. Payrolls now loom as the key test of whether the latest hawkish repricing sticks or sinks.


Euro Short-term Outlook: EUR/USD Pullback Nears Pivotal Uptrend Support 8 28 2026
Warsh's comments accelerated the EUR/USD selloff, raising the stakes as buyers look to stabilize the broader recovery.