


Nikkei threatens breakout as tech rebound broadens
Breakouts across the SOX and Nasdaq are being matched by rebounds across Asia, with the Nikkei now threatening to join the move.
Written by
David Scutt
Market Analyst
- SOX and Nasdaq break higher as tech sentiment broadens
- KOSPI and SOX lead rebounds from August lows
- Nikkei tests 66,800 with momentum indicators turning bullish
Whether you’re talking the SOX index in the United States, the broader Nasdaq, or an increasing number of other tech-related indices, the bulls are clearly starting to stir, with breakout after breakout after breakout seen over the past couple of days.
Regardless of whether you’re talking about the upstream nuts and bolts of the AI build-out or the lower-beta end of the market dominated by the hyperscalers, all are starting to come back to life, albeit from very different levels.
SOX breaks first, Nasdaq follows
Source: TradingView
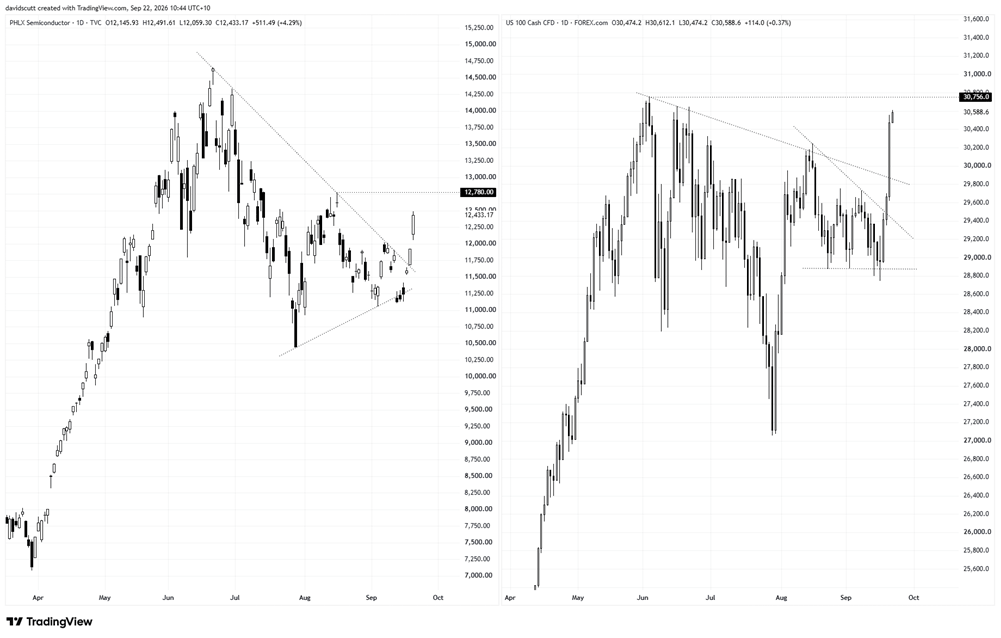
As you can see in the side-by-side chart above, we saw a strong breakout through downtrend resistance in the SOX on Friday. Lo and behold, Nasdaq futures have started the new week by ramping higher as well, with the record highs now back in sight.
It’s not just the US tech darlings feeling the love, with the dominant tech players in Asia also showing signs of rebounding strongly after copping the full heat of the drawdown earlier this year.
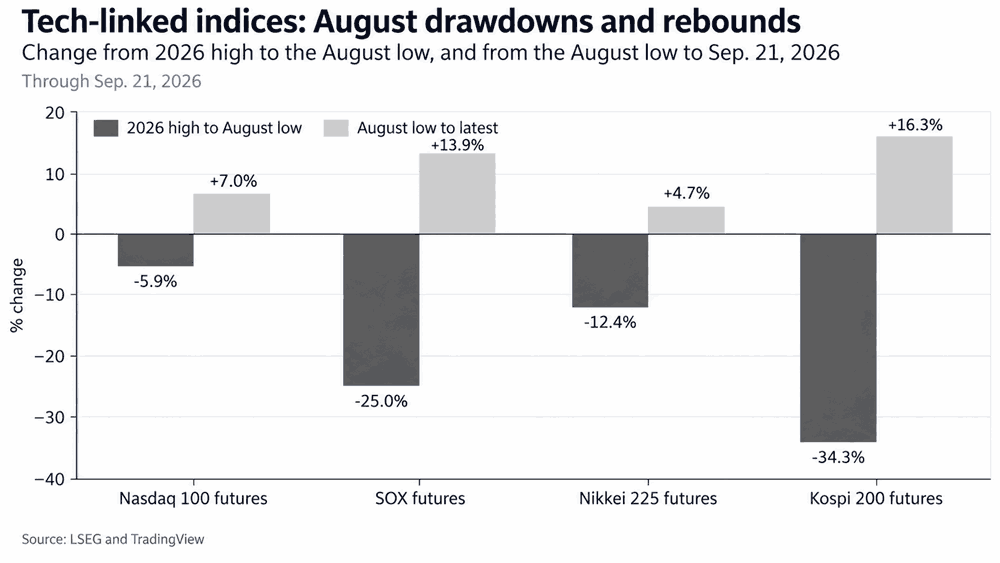
From the recent August lows, the rebound has been strongest in some of the markets that were hit hardest. KOSPI 200 futures have recovered 16.3%, SOX futures 13.9%, Nasdaq 100 futures 7%, and Nikkei futures 4.7%.
Source: LSEG, TradingView
While the Nikkei has lagged the overall move, don’t assume that means it has to play catch-up. Instead, what it demonstrates is that we’re seeing the rebound broaden, spanning everything from the semis to the large-cap US tech names.
Technicals explain plenty
While company-specific narratives have been plentiful as justification for the bullish turn, with Meta’s Muse topping Apple’s app download charts the latest apparent catalyst to spark a wave of bullish sentiment, you wouldn’t need any of that information if you were looking solely at the charts. Technicals explain plenty!
Then throw in what’s been happening with crude, with movements in oil demonstrating the ability to shift broader sentiment across rates, currencies and equities, regardless of whether some of those relationships are bordering on the spurious and then some.
Semis and the broader US tech complex don’t appear to be any exception, adding another bullish dimension to the price action we’ve seen over the past couple of sessions.
With both semis and the broader US tech complex breaking higher within a matter of sessions, attention now falls on similar markets yet to fully join the move.
The Nikkei looks like it could be the next domino to fall.
Nikkei probes stubborn resistance
Source: TradingView
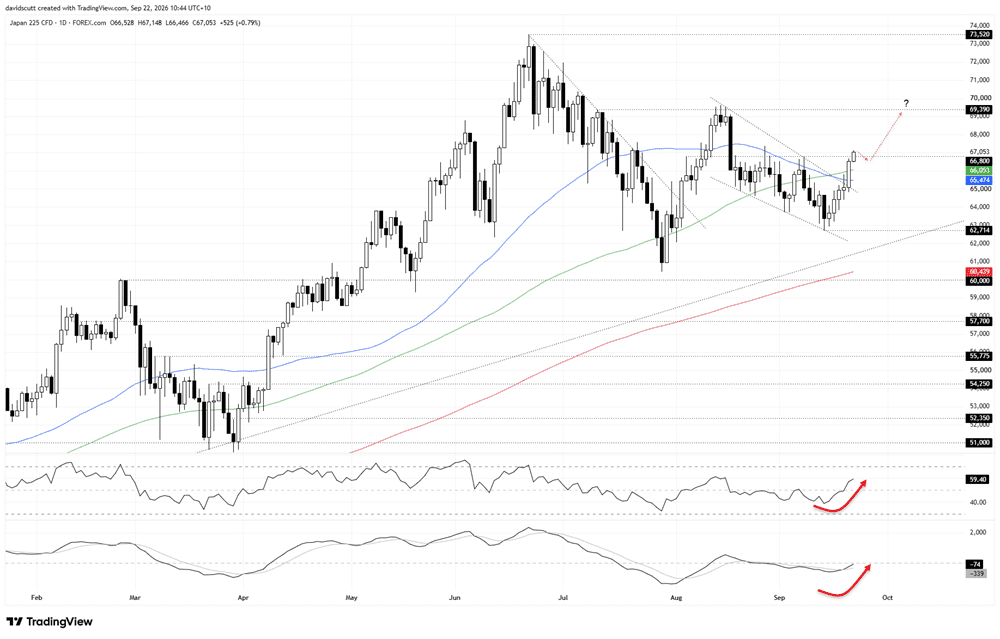
The index broke the falling wedge it had been coiling in for well over a month on Monday, pushing through both the 50 and 100-day moving averages before stalling at 66,800, a resistance level that capped the price for lengthy periods in August and early September.
While we’ve seen multiple moves through the level, none have stuck, making it the focal point today. We’ve seen the price move back above 66,800 in early Asia, albeit in thin trading with Japanese markets still closed for a prolonged five-day long weekend. As such, while there should be a caveat on the bullish price action, the close today still looms as important.
With RSI (14) trending higher and now back above 50, and MACD having staged a bullish crossover and sitting on the cusp of flipping positive, upside momentum looks to be building, favouring buying dips and breakouts.
If we were to see the current move above 66,800 stick, preferably on a closing basis, longs could be set above the level with a tight stop beneath for protection, initially targeting a test of 69,390, where the index has stalled on four separate occasions earlier this year. 67,366 is a level of note in between, marking the high set on August 27.
A sustained break of 69,390 would have bulls salivating at the prospect of a potential retest of the record highs at 73,520.
If the move above 66,800 fails once again, it would bring the immediate bullish bias into question, opening the door to setups targeting moves in either direction.
Latest market news










Web Trader platform
Our sophisticated web-based platform is packed with features.
Open an account today
Experience award-winning platforms with fast and secure execution.
Economic calendar
Related articles

Gold and S&P 500 analysis: What now after Warsh’s hawkish speech?
The dollar surged across the board after the Fed Chair Kevin Warsh surprised with a hawkish-leaning speech at the Jackson Hole summit. All the bearish dollar bets that had been accumulated since last Friday on the back of data weakness and bond market troubles had to be squared and that triggered a short squeeze rally for the dollar. Gold and silver dropped, as a result, as too did bitcoin, while US indices were giving back earlier gains.


EUR/USD forecast: All eyes on Warsh at Jackson Hole - Forex Friday
For much of this week, the EUR/USD has been edging lower with the US dollar regaining some ground after last week’s sell-off that was triggered, in part, by the bond market worries. Investors have been unwilling to bet further against the US dollar so far this week ahead of Kevin Warsh’s keynote speech at the Jackson Hole summit, due later today.

Bitcoin Forecast: BTC/USD Back to $80K Ahead of Warsh’s Jackson Hole Speech
After surging over $15,000 in the past 10 days alone, there is risk of a near-term pullback if Warsh says anything remotely hawkish at Jackson Hole - what are the levels to watch from here?
