


Oil Price Forecast: WTI Breakout Extends 11% – Rally Faces First Major Hurdle 1 13 2026
Oil prices are surging with a breakout of the July downtrend now testing the first major resistance zone. Battle lines drawn on the WTI technical charts.
Written by
Michael Boutros
Sr. Technical Strategist
Crude Oil Technical Forecast: WTI Weekly, Daily & Intraday Trade Levels
- Oil surges more than 11.8% off the December low with a breakout of a five-month downtrend poised to mark a fourth consecutive weekly advance
- WTI rally is now testing initial resistance at a key pivot zone, where multiple technical levels converge, raising the risk for a near-term reaction.
- Medium-term outlook shifts to the topside, but the immediate advance may be vulnerable while below resistance
- Resistance 61.44-62.05 (key), ~62.36, 62.90- Support 59.33, 58.44, 57.58 (key)
WTI has delivered a decisive breakout from a multi-month downtrend, with the sharp advance from the December lows marking a clear shift in market structure. The recovery has been swift and technically meaningful, propelling price into its first major resistance test since the trend turned higher. This area now represents a critical checkpoint for the rally, as the market assesses whether the breakout can transition into a sustained advance or pauses here after an extended run. The reaction at this level should provide key insight into the durability of the move as crude trades into the heart of the month. Battle lines drawn on the weekly, daily, and 240min technical charts.
Review my latest Weekly Strategy Webinar for an in-depth breakdown of this crude oil setup and more. Join live on Monday’s at 8:30am EST.
Oil Price Chart – WTI Weekly

Chart Prepared by Michael Boutros, Technical Strategist; WTI on TradingView
Technical Outlook: In last month’s Oil Price Forecast we noted that WTI was testing near-term support and that a close below 56.83 would be needed to fuel the next major leg of the decline. We highlighted the next major support zone, “at the 61.8% extension of the broader 2022 decline, the 2016 high, and the 2025 swing low at 54.36-55.10. Note that the 25% parallel converges on this threshold over the next few weeks- look for a larger reaction there IF reached.” WTI broke lower five-days later with a decline of more than 9.1% off the December high registering a fresh yearly low at 54.98 before rebounding.
The subsequent recovery is now poised to mark a fourth-consecutive weekly advance with the rally extending more than 11.8% off the December low. A break above the late-July downtrend (red) this week suggests a more significant low is in place and a larger trend reversal is underway with the advance now approaching the first major level of technical resistance.
Oil Price Chart – WTI Daily
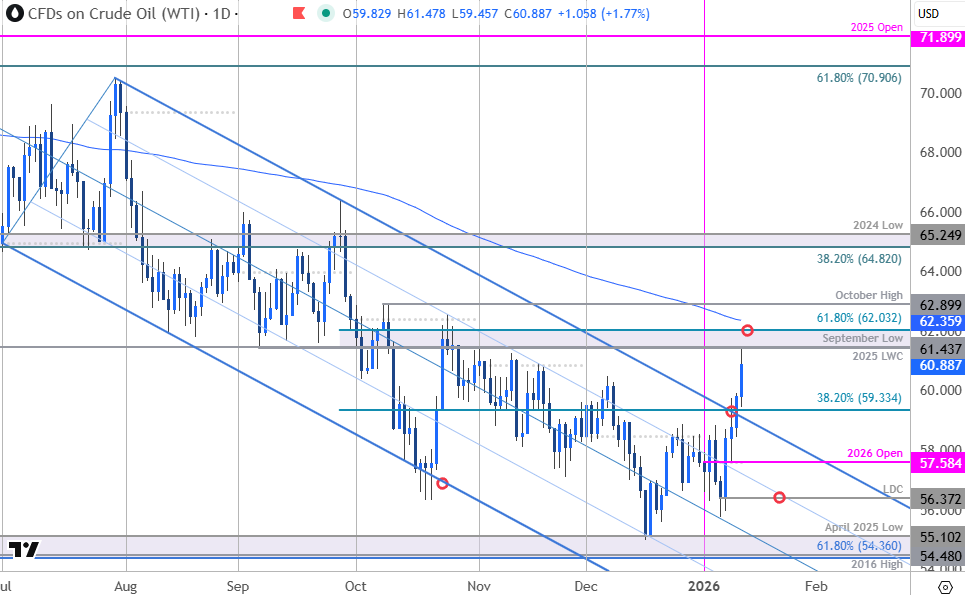
Chart Prepared by Michael Boutros, Technical Strategist; WTI on TradingView
A look at the daily chart shows WTI breaching the multi-month downtrend yesterday with a four-day rally extending into resistance today at 61.43-62.05- a region defined by the April 2025 low week close, the September low, the 61.8% retracement of the September decline, and the 100% extension of the late-December advance. Looking for a reaction off this threshold in the days ahead with a breach / daily close above needed to fuel the next leg of the advance.
Oil Price Chart – WTI 240min
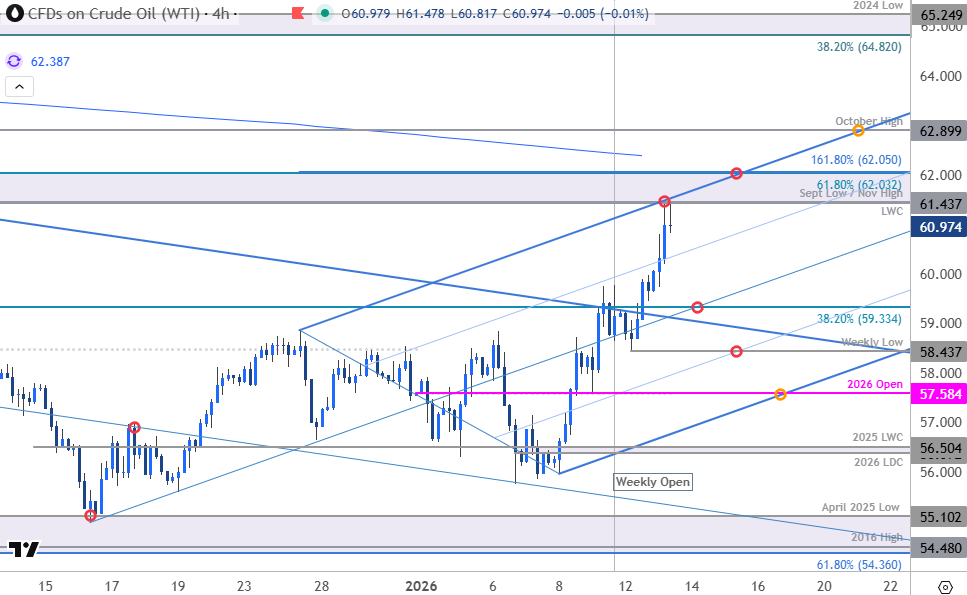
Chart Prepared by Michael Boutros, Technical Strategist; WTI on TradingView
A closer look at oil price action shows WTI trading within the confines of an ascending pitchfork extending off the December low with the upper parallel further highlighting immediate resistance into 61.43-62.05. Initial support rests with the 38.2% retracement at 59.33 and is backed by the weekly low at 58.44. Near-term bullish invalidation is now set to the objective yearly open at 57.58. Note that the lower parallel converges on this level early next week and a break / daily close below would be needed to suggest a more significant high is in place and potential resumption of the broader downtrend. Subsequent support seen at the January low-day close (LDC) and the 2025 low-week close (LWC) at 56.37/50 with key support steady at 54.36-55.10.
A topside breach / daily close above this key pivot zone exposes the 200-day moving average (currently ~62.36) and the October high at 62.90. The next major technical consideration is eyed at the 38.2% retracement of the 2025 trading range and the 2024 swing low at 64.52-65.25. This is a zone of interest for possible topside exhaustion / price inflection- look for a larger reaction there IF reached
Bottom line: Oil has broken out of a multi-month downtrend with the advance now testing initial resistance hurdles at the November highs. While the breakout does shift the medium-term outlook higher, the immediate advance may be vulnerable while below this level. From a trading standpoint, losses would need to be limited to 59.33 IF price is heading higher on this stretch with a close above 62.05 needed to fuel the next major leg of the advance.
Active Weekly Technical Charts
- Euro (EUR/USD)
- Canadian Dollar (USD/CAD)
- Japanese Yen (USD/JPY)
- Bitcoin (BTC/USD)
- Australian Dollar (AUD/USD)
- Gold (XAU/USD)
- British Pound (GBP/USD)
- US Dollar Index (DXY)
- Swiss Franc (USD/CHF)
- S&P 500, Nasdaq, Dow
--- Written by Michael Boutros, Senior Technical Strategist
Follow Michael on X @MBForex







Web Trader platform
Our sophisticated web-based platform is packed with features.
Open an account today
Experience award-winning platforms with fast and secure execution.
Economic calendar
Related articles

USD/JPY weekly outlook: Payrolls may challenge the Fed’s hawkish reset
USD/JPY has finally woken from its slumber. Payrolls now loom as the key test of whether the latest hawkish repricing sticks or sinks.

Euro Short-term Outlook: EUR/USD Pullback Nears Pivotal Uptrend Support 8 28 2026
Warsh's comments accelerated the EUR/USD selloff, raising the stakes as buyers look to stabilize the broader recovery.

Nasdaq 100 Forecast: NDX slips ahead of Fed Chair Warsh’s speech
U.S. stocks are edging lower on Friday, giving back some of yesterday's gains after Nvidia's strong outlook revived the tech trade. The focus has now shifted firmly to Fed Chair Kevin Warsh's Jackson Hole speech, with investors looking for more clarity on the outlook for interest rates.
