


SP 500 Analysis SPX Continues to Struggle for Direction Near Record Highs
Recent trading sessions around SPX have failed to show a particularly strong sense of confidence for the equity index. Over the last four trading sessions, average price movements have barely reached 1.00%, a figure that remains below the fluctuations seen weeks ago, when daily moves above 1.5% were relatively common.
Written by
Julian Pineda
Market Analyst
Recent trading sessions around SPX have failed to show a particularly strong sense of confidence for the equity index. Over the last four trading sessions, average price movements have barely reached 1.00%, a figure that remains below the fluctuations seen weeks ago, when daily moves above 1.5% were relatively common. This situation is important because it reflects a slowdown in overall market activity and is beginning to give greater relevance to a phase of neutrality. For now, demand continues to face an environment where geopolitical tensions and uncertainty surrounding the Federal Reserve are limiting appetite for risk assets. As long as this dynamic remains in place, a period of indecision could continue to play an important role in SPX price action over the coming sessions.
Short-Term Confidence Begins to Moderate
At the moment, markets are facing a combination of factors that could continue limiting confidence across risk assets. The first is the increase in tensions between the United States and Iran, where recent attacks continue to reduce the likelihood of more meaningful negotiations in the short term and are once again raising geopolitical concerns.
This situation has already had repercussions in the energy market. WTI crude oil has advanced toward the $90 per barrel area, a move that could increase the market risk premium and reignite concerns about potential global inflationary pressures.
The second factor is linked to the Federal Reserve. Markets are already pricing in the possibility of an interest rate increase toward the 4.00% area at the next monetary policy decision in September. This expectation remains in place even ahead of the upcoming NFP employment data, which could further reinforce the perception that there is room for a more aggressive stance from the central bank if economic conditions continue to show resilience.
This environment has also increased the attractiveness of assets considered relatively more stable. U.S. 10-year Treasury yields have already reached the 4.8% area, marking new highs for 2026 and strengthening interest in alternative markets relative to equities.
The combination of these developments is not particularly supportive of risk sentiment. Both rising geopolitical tensions and the possibility of higher interest rates continue to increase overall uncertainty. In fact, this situation is already reflected in the recent behavior of the Fear & Greed Index, which has moved away from neutral levels and returned to the "Fear" zone during the week, signaling that risk appetite has once again come under pressure.
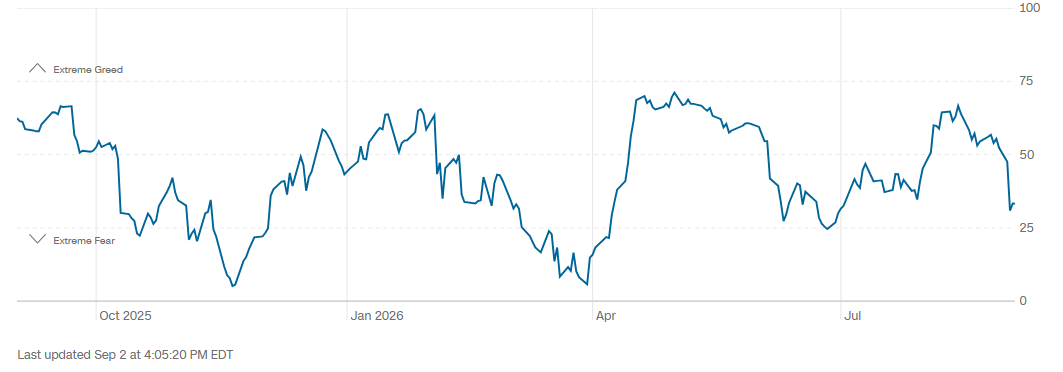
Source: CNN
This dynamic is also beginning to appear among the largest components of the S&P 500. Looking at the ten most important companies within the index, only Nvidia stands out with gains close to 3.00% during the session. However, the rest of the companies continue to post much more limited movements and lack a clear direction, suggesting that buying confidence has not yet managed to stabilize consistently across the equity market.
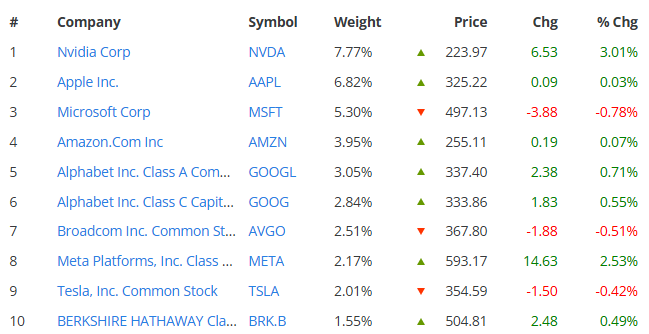
Source: Slickcharts
Taking all of this into account, the combination of geopolitical risks and uncertainty surrounding the future path of interest rates could continue limiting demand activity within the S&P 500. For now, this does not point to a clearly pessimistic environment, but rather to a more cautious market stance that could continue favoring a period of indecision as long as these factors remain present.
S&P 500 Technical Outlook
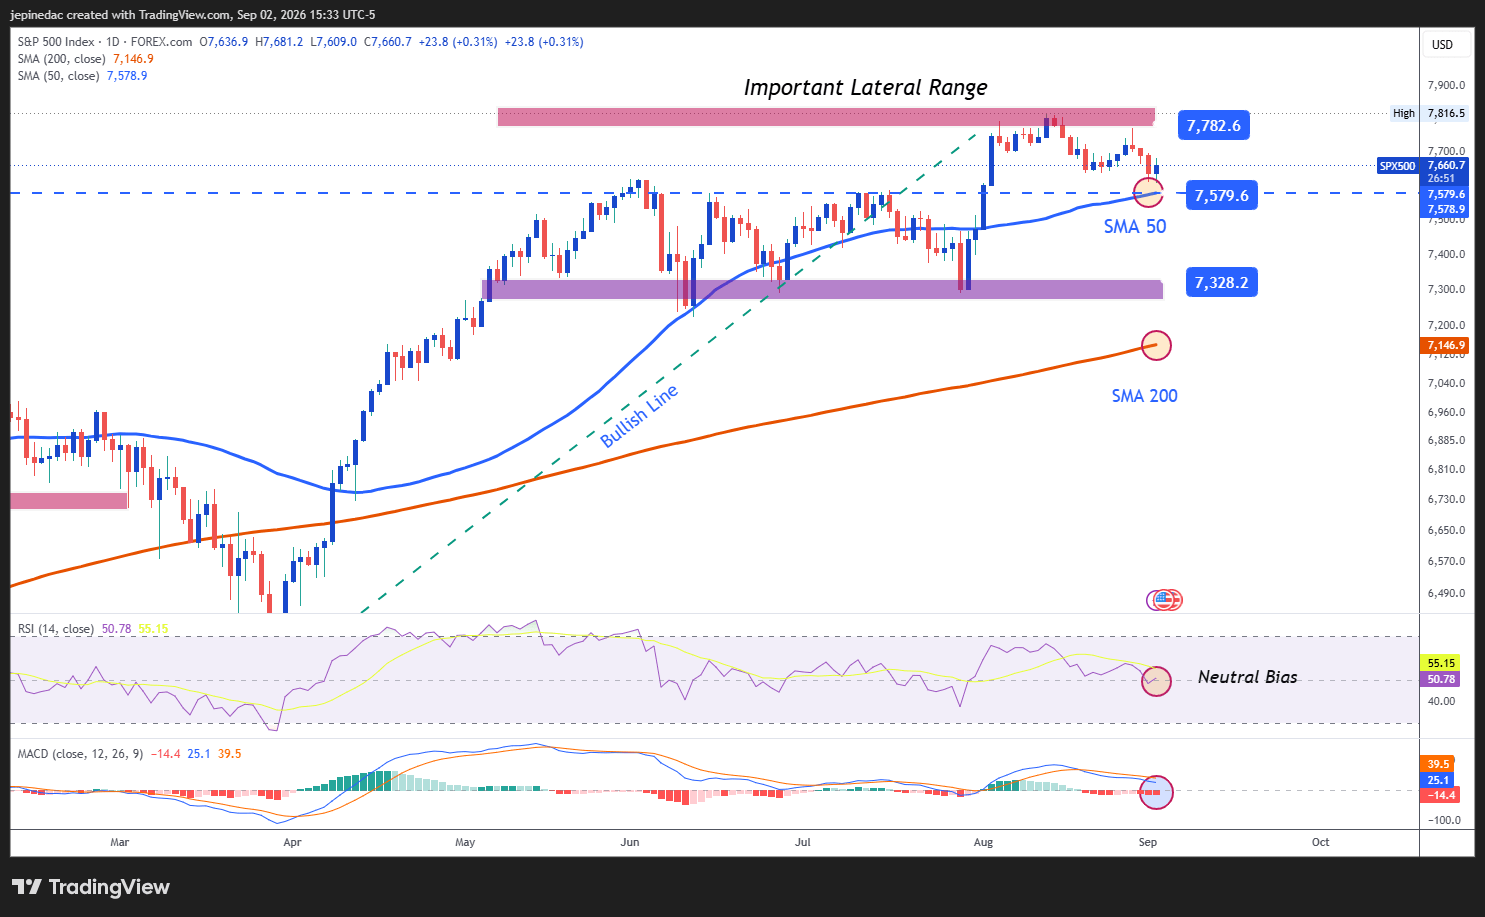
Source: StoneX, Tradingview
- The Trading Range Continues to Gain Relevance: For several weeks, the S&P 500 has remained within a well-defined trading range, with resistance around 7,780 points and support near 7,300 points. This structure has remained intact because recent price action continues to lack the momentum needed to break through key levels. As long as this dynamic persists, the range is likely to remain the most important technical reference on the chart.
- RSI: Recent RSI readings remain close to the neutral 50 level, suggesting that the balance between buying and selling momentum has remained relatively stable over the last 14 sessions. While this behavior continues, neutrality could remain a dominant feature of short-term price action.
- MACD: A similar picture can be seen in the MACD, whose histogram continues to move very close to the neutral 0 line. This reflects balance in the average strength of short-term moving averages and continues to support a broader consolidation phase within the index.
Key Levels:
- 7,780 Points – Key Resistance: This area corresponds to the index's all-time highs and remains the most important upside reference on the chart. Price action that manages to return to this level could strengthen the bullish bias and restore relevance to the bullish structure that dominated previous weeks.
- 7,570 Points – Nearby Barrier: This level coincides with the 50-period Simple Moving Average and with important retracement areas observed in previous weeks. As long as the price continues to fluctuate around this reference, the current consolidation phase could remain in place and the trading range may continue acting as the dominant market structure.
- 7,300 Points – Key Support: This area coincides with important lows recorded over recent weeks and remains the main downside barrier within the market. Sustained trading below this level could reinforce a more dominant bearish bias and open the door to more consistent downside pressure over the coming weeks.
Written by Julian Pineda, CFA, CMT – Market Analyst
Follow him on: @julianpineda25
Latest market news







Web Trader platform
Our sophisticated web-based platform is packed with features.
Open an account today
Experience award-winning platforms with fast and secure execution.
Economic calendar
Related articles

Gold and S&P 500 analysis: What now after Warsh’s hawkish speech?
The dollar surged across the board after the Fed Chair Kevin Warsh surprised with a hawkish-leaning speech at the Jackson Hole summit. All the bearish dollar bets that had been accumulated since last Friday on the back of data weakness and bond market troubles had to be squared and that triggered a short squeeze rally for the dollar. Gold and silver dropped, as a result, as too did bitcoin, while US indices were giving back earlier gains.

S&P 500 Forecast: SPX after Nvidia revives confidence in the AI trade
U.S. stocks are heading higher on Thursday, with technology leading the move after Nvidia's stronger-than-expected outlook revived confidence in the AI trade.


DAX and EUR/USD forecast: Lower energy prices, yields offer support
But the question, of course, is how much further oil prices and bond yields can fall. For now, the combination is supportive of risk assets and is helping to sustain a relatively benign decline in the dollar. The focus today will be on US core PCE inflation, due for release shortly, while Nvidia’s second-quarter earnings will provide another test for risk appetite after the US markets close – not just for US indices but for global tech-heavy indices given the influence Nvidia has over the global tech and AI names.