


US Dollar Bulls Tighten Grip, Yen Bears Pile In: FX Futures Positioning | COT Report
US dollar bulls strengthened their grip as positioning reached a 10-year high, while bearish bets against the Japanese yen continued to accelerate.
Written by
Matt Simpson
Market Analyst
US dollar bulls remain firmly in control heading into a pivotal week for markets, with net-long exposure climbing to a fresh 10-year high. At the same time, traders continued to increase bearish bets against the Japanese yen as expectations for further BOJ tightening faded. Here's what the latest COT report reveals across the major currency futures markets.
View related analysis:
US Dollar Strength and Bearish Yen Bets Dominate the Latest COT Report
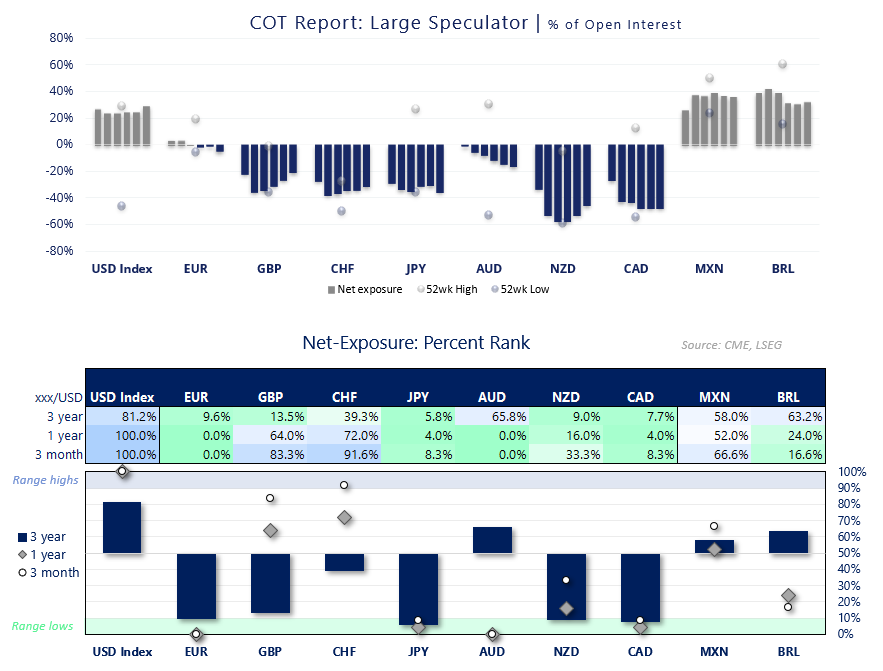
Large Speculator Positioning from the COT report
Source: CFTC (COT), LSEG
For traders wanting a deeper understanding of futures positioning, I’ve also published a guide on how to read and interpret weekly COT data in forex markets.
- US Dollar: Net-long exposure increased by $4.1 billion to a 10-year high of $42.6 billion.
- EUR/USD: Large speculators increased net-short exposure to a 17-month high of 41.4k contracts.
- GBP/USD: Net-short exposure fell for a fifth consecutive week to 55.6k contracts among large speculators.
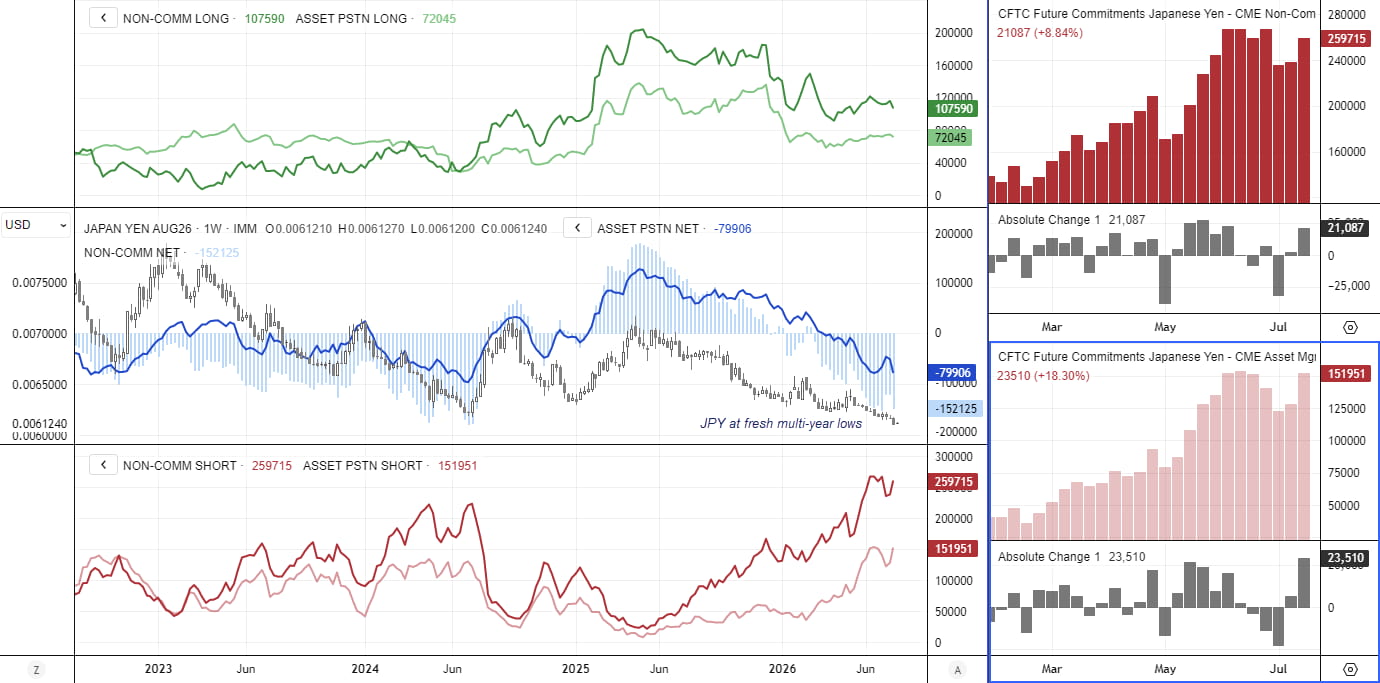
- USD/JPY: Rising short bets against the Japanese yen pushed net-short exposure to near a two-year high.
- USD/CHF: Net-short exposure fell for a fourth consecutive week to 34.2k contracts.
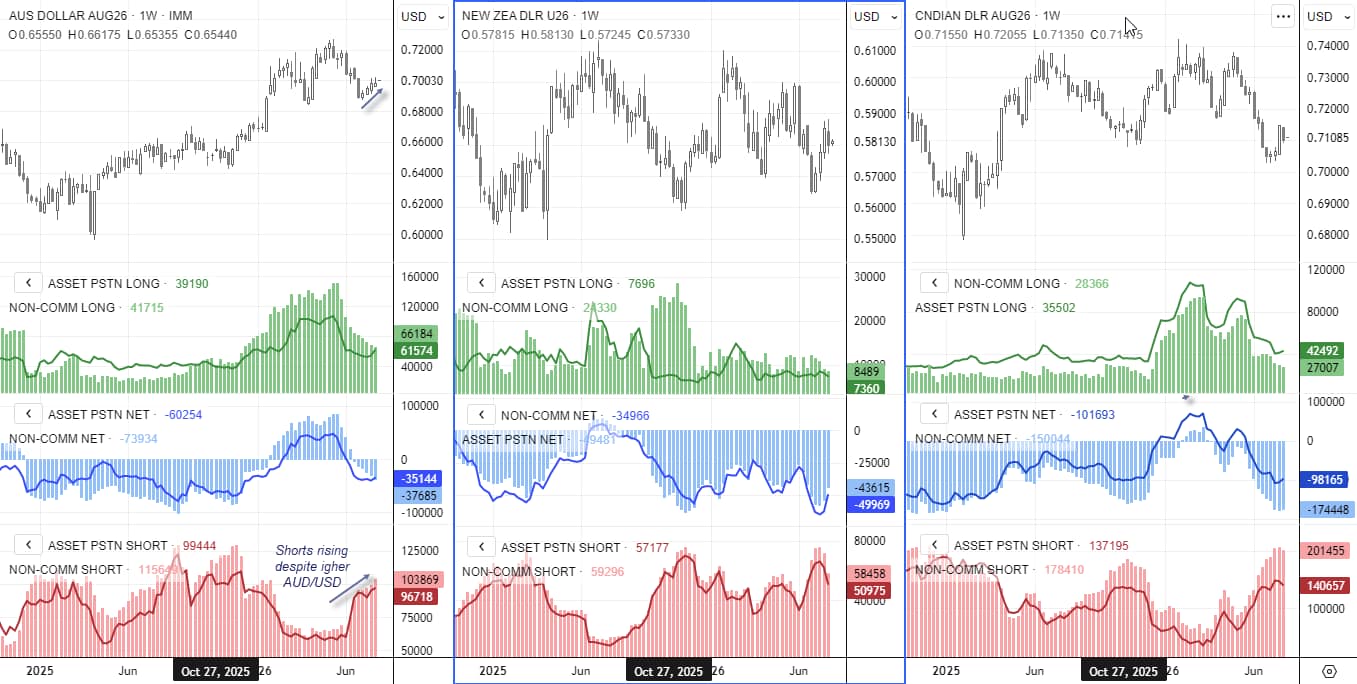
- USD/CAD: Only minor changes over the week left net-short exposure near an 18-month high.
- AUD/USD: Net-short exposure edged higher to 37.7k contracts, despite AUD/USD rising for a third consecutive week.
- NZD/USD: Large speculators reduced their net-short exposure by around 24% to 50k contracts.
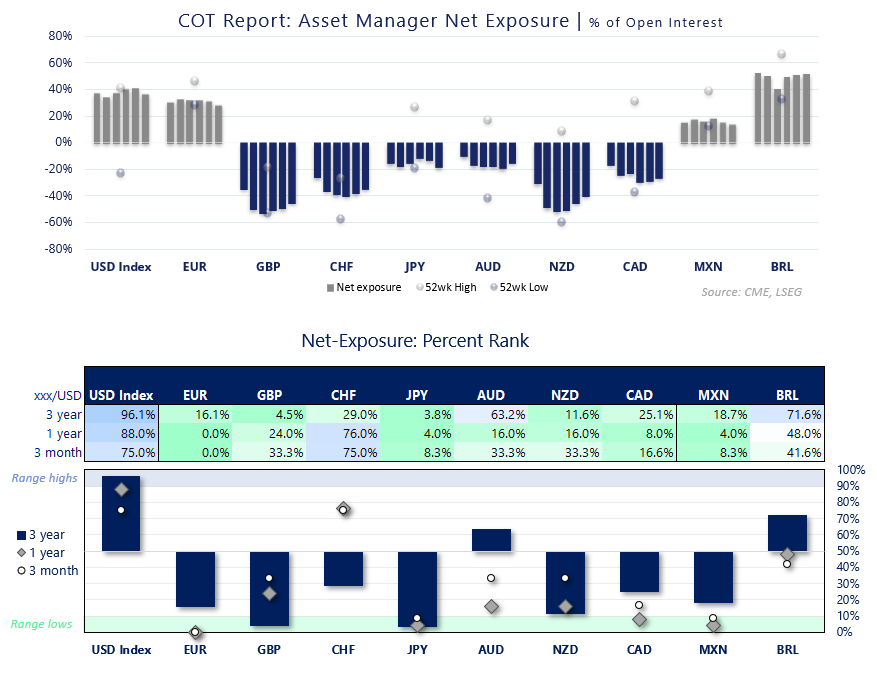
Asset Manager Positioning | COT Report
Source: CFTC (COT), LSEG
FX Futures Positioning | COT Report (IMM Data)
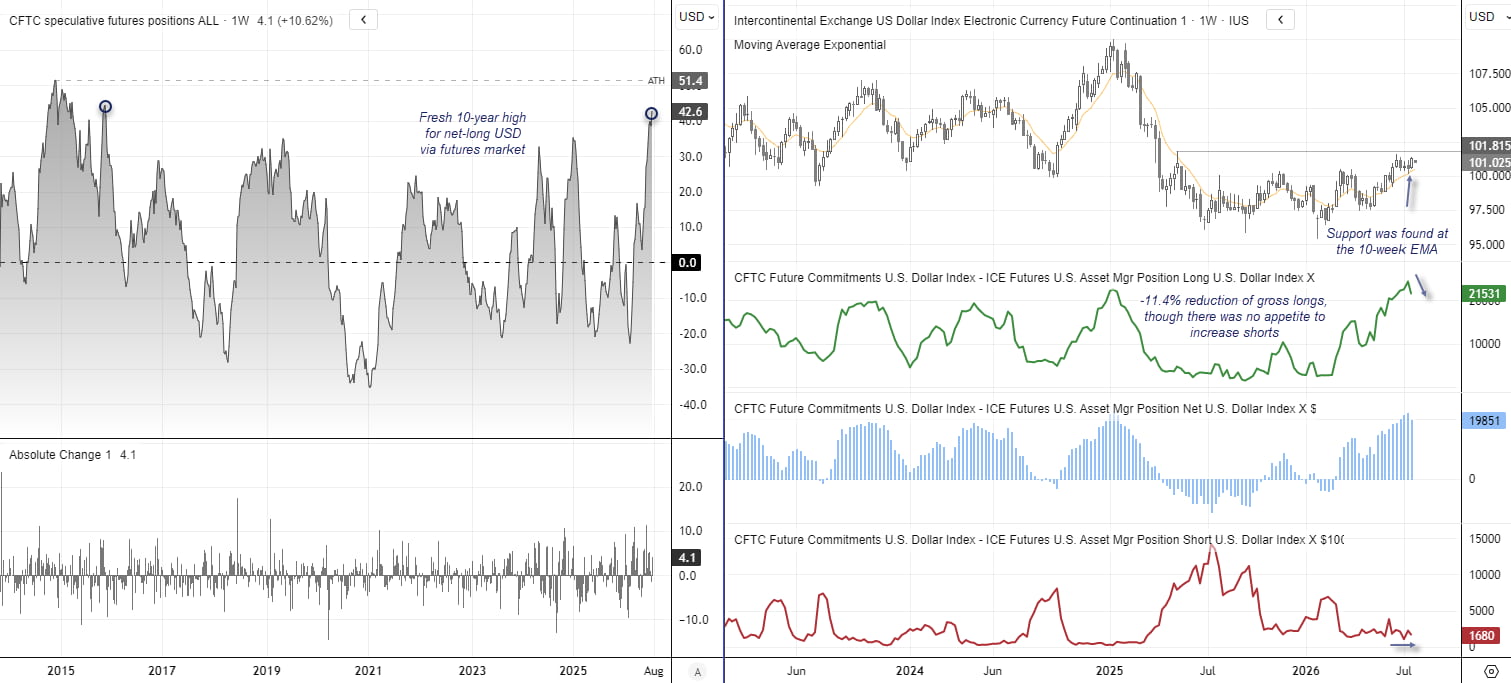
US Dollar Index (DXY) Futures Positioning | COT Report
The weekly chart on the right shows the US dollar remains in a solid uptrend and could be on track to test 102, particularly if the Fed strikes a hawkish tone this week. Support emerged at the 10-week EMA ahead of last week's bullish range expansion.
It is also noteworthy that asset managers reduced gross long exposure by 21.5k contracts (-11.2%), pulling net-long exposure back from an 18-month high. However, there was no meaningful increase in short positions, suggesting the reduction was driven by long liquidation rather than fresh bearish bets.
Meanwhile, overall net-long exposure to the US dollar via futures contracts rose by $4.1 billion to a fresh 10-year high of $42.6 billion. Whether dollar bulls can extend the rally towards 102 may now hinge on this week's Fed meeting and developments in the Middle East.
Source: CFTC (COT), ICE, LSEG
This content was created by an affiliate of FOREX.com and represents the views and opinions of the author/speakers, not the views and opinions of FOREX.com, StoneX Group Inc., or its subsidiaries. The content has not been independently reviewed by FOREX.com.
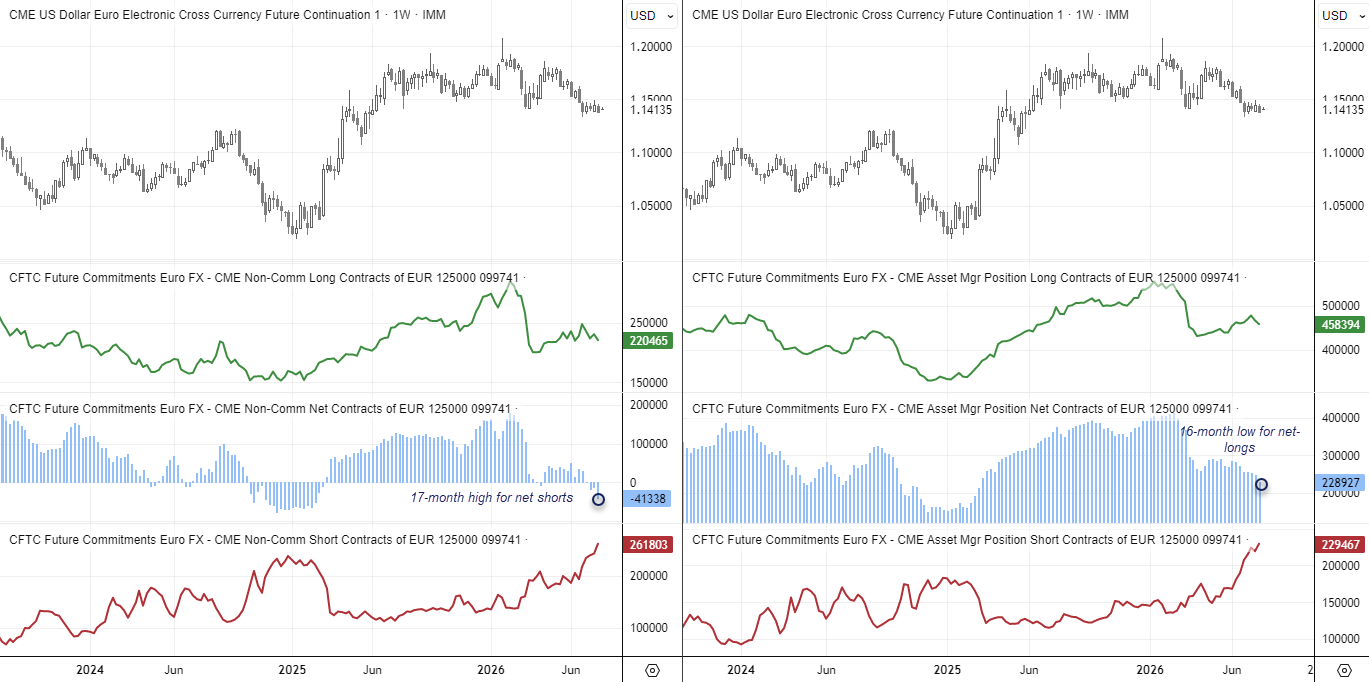
EUR/USD Futures Positioning | COT Report
The weekly chart remains in a clear downtrend, with last week’s bearish candle hinting at a bear flag breakout for the euro. Bears on the futures market seem confident of a breakout, given gross-shorts have risen to a post-covid high among large speculators and a fresh record high among asset managers. Despite these bearish stats, larges specs are only net-shorts 41.3k contracts – which hardly a sentiment extreme, all things considered.
Source: CFTC (COT), CME, LSEG

USD/JPY Futures Positioning | COT Report
The Japanese yen's decline has been allowed to continue, with Japan's Ministry of Finance (MOF) showing little appetite to intervene and the Bank of Japan (BOJ) offering no signal that another rate hike is imminent. As a result, bearish bets against the yen increased sharply, with traders adding a combined 44.5k net-short futures contracts last week alone.
Given the broader macro backdrop, this is one of the rare occasions where I am willing to look past the extreme level of gross shorts on a currency. Besides, net-short exposure has yet to reach a comparable sentiment extreme.
If US CPI surprises to the upside, the Fed leans hawkish and Middle East tensions remain elevated, USD/JPY appears more likely to extend its rally than reverse, in my view. An MOF intervention would, of course, quickly change that outlook. However, the authorities' recent reluctance to act suggests they are unwilling to fight this trend again, especially after their previous two interventions failed to produce a lasting reversal.
Source: CFTC (COT), CME, LSEG
Commodity FX Futures Positioning (AUD, CAD, NZD) | COT Report
Only minor adjustments were made to Canadian dollar futures, with net-short exposure easing slightly among both large speculators and asset managers.
We finally saw a meaningful reduction in gross and net-short exposure to the New Zealand dollar as traders belatedly responded to NZD/USD's rebound. However, with a two-bar bearish reversal (dark cloud cover) forming on NZD/USD last week, it is worth noting that bullish bets failed to increase over the preceding three weeks.
The standout move was in Australian dollar futures, where AUD/USD has risen for three consecutive weeks despite an increase in gross-short exposure. Given the rebound remains lacklustre, and I suspect expectations for further RBA rate hikes have become overblown, I think the rally could be nearing exhaustion. A move lower may now be on the cards, especially if this week's Australian CPI undershoots expectations and the Fed leans hawkish.
Source: CFTC (COT), CME, LSEG
View the full economic calendar
-- Written by Matt Simpson
Follow Matt on Twitter @cLeverEdge
How to trade with City Index
You can trade with City Index by following these four easy steps:
- Open an account, or log in if you’re already a customer
• Open an account in the UK
• Open an account in Australia
• Open an account in Singapore
- Search for the market you want to trade in our award-winning platform
- Choose your position and size, and your stop and limit levels
- Place the trade
Related tags:






Web Trader platform
Our sophisticated web-based platform is packed with features.
Open an account today
Experience award-winning platforms with fast and secure execution.
Economic calendar
Related articles

USD/JPY weekly outlook: Payrolls may challenge the Fed’s hawkish reset
USD/JPY has finally woken from its slumber. Payrolls now loom as the key test of whether the latest hawkish repricing sticks or sinks.


Japanese Yen Forecast: USD/JPY Survives 5% Intervention Plunge – Uptrend at Risk 8 25 2026
USD/JPY remains perched above major trend support as intervention risk and Jackson Hole raise the stakes for the next directional move.

AUD/USD slips as DXY ignores the playbook
The US dollar moved against its recent macro playbook on Monday. AUD/USD paid the price, although bulls still hold the upper hand.